How to Monitor Containers in Docker?
After you run containers in Docker on your server or your Docker Host, you should monitor all existing containers to find out the performance of each container.
Problem
How to monitor containers in Docker?
Solution
There are 2 methods for container monitors in Docker:
A. Via CLI
In CLI, to monitor all containers in Docker, you can use the command:
docker stats
You will see the display as below:

From the image above, you can see that the command displays the results in streaming, and to exit from the command above, press Ctrl+Z or Ctrl-C. If you don’t want to display the results in streaming mode, then use the command below:
docker stats --no-stream 
B. Via Website
If you want to monitor Docker via a website, you can use the Portainer tool. Portainer is a tool for managing containers through a browser that can support Docker host, Docker Swarm, Nomad, and Kubernetes. It has 2 components, namely Portainer Server, which is used to manage containers, networks, and environments, and Portainer Agent is the component installed on another Docker system to enable communication with the server. Portainer has 2 editions, namely Portainer Business Edition or PBE and Portainer Community Edition or PCE, where both editions at the time of this writing (April 2025) have version 2.27.3. This article will discuss how to install Portainer Community Edition. Here are the steps:
1. Create Docker Volume
Type the command below to create a new volume in Docker:
docker volume create portainer_data
2. Install Portainer
Type the command below to install the latest version of Portainer:
docker run -d \
-p 8000:8000 \
-p 9443:9443 \
--name portainer \
--restart=always \
-v /var/run/docker.sock:/var/run/docker.sock \
-v portainer_data:/data portainer/portainer-ce
3. Check the Portainer
The following command can be used to determine whether Portainer is operating or not:
docker ps
4. Access the Portainer
After that, open your browser and type:
https://your_IP_server:9443
There will be an image like below:

A picture similar to the one below will appear when you click the Advanced button:
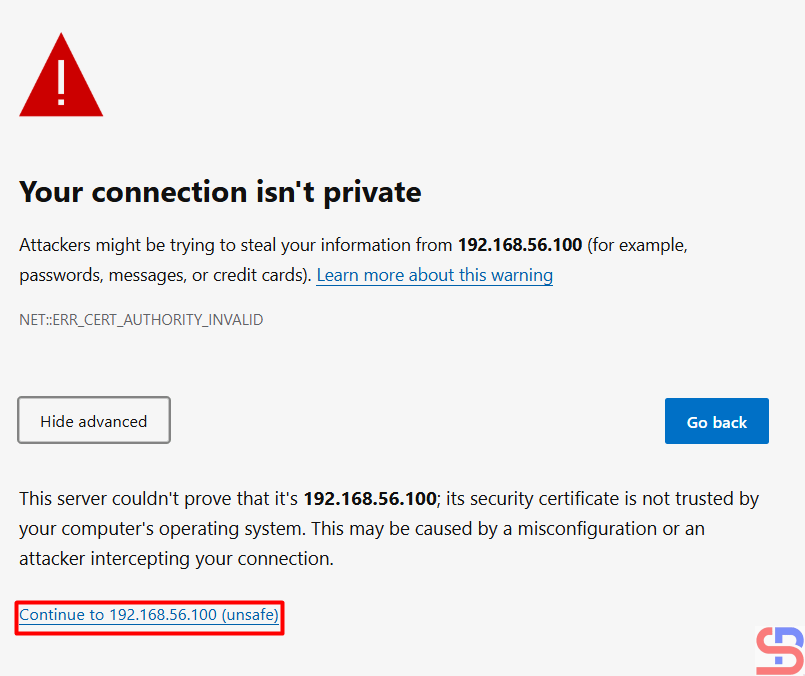
Click the unsafe link in your browser, and then there will be an image like below:
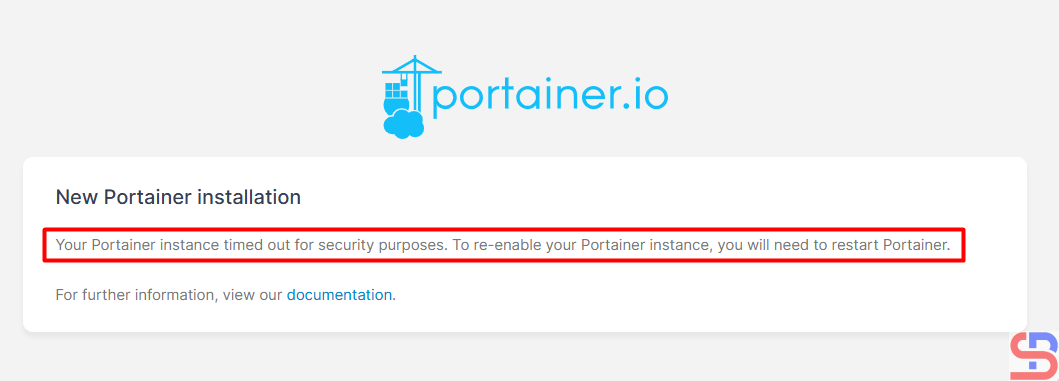
If you have an error like the picture above, then restart Portainer by running the command below:
docker restart portainer
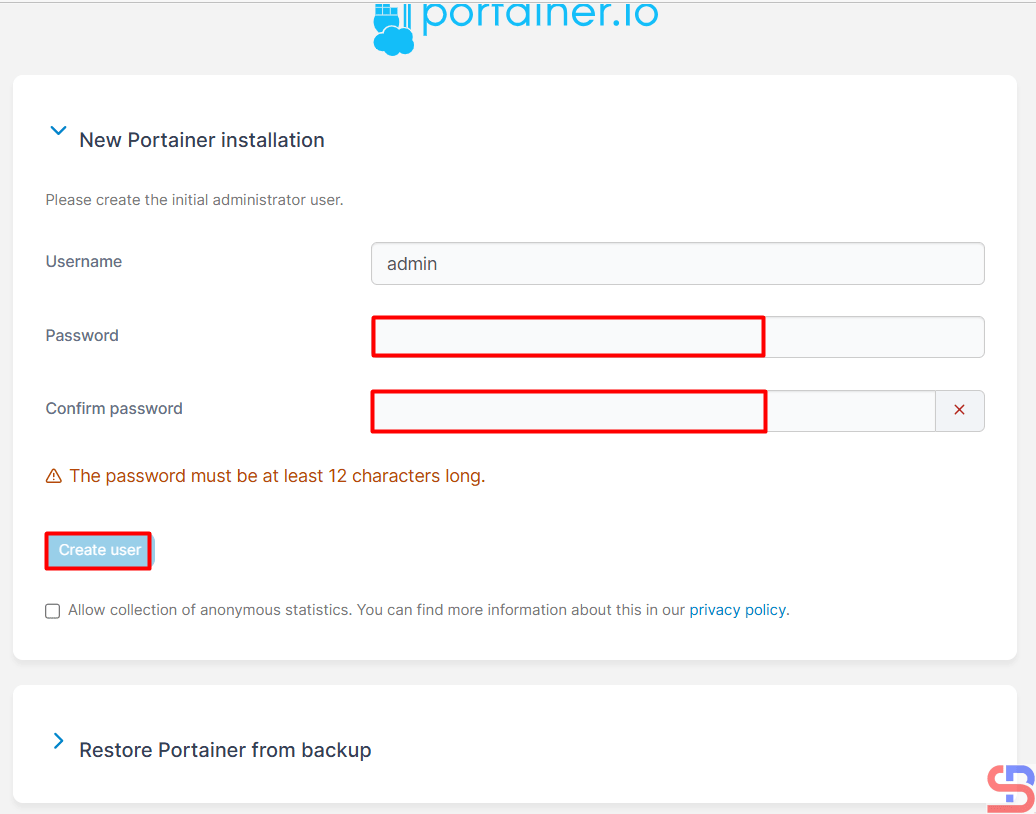
Enter the desired name and password, then click the Create user button, and you will see an image below:
The Portainer dashboard will appear. Click the Get Started box like in the above image, and there will be an image below:

There will be an image below:

Click on the red box, and there will be an image below:
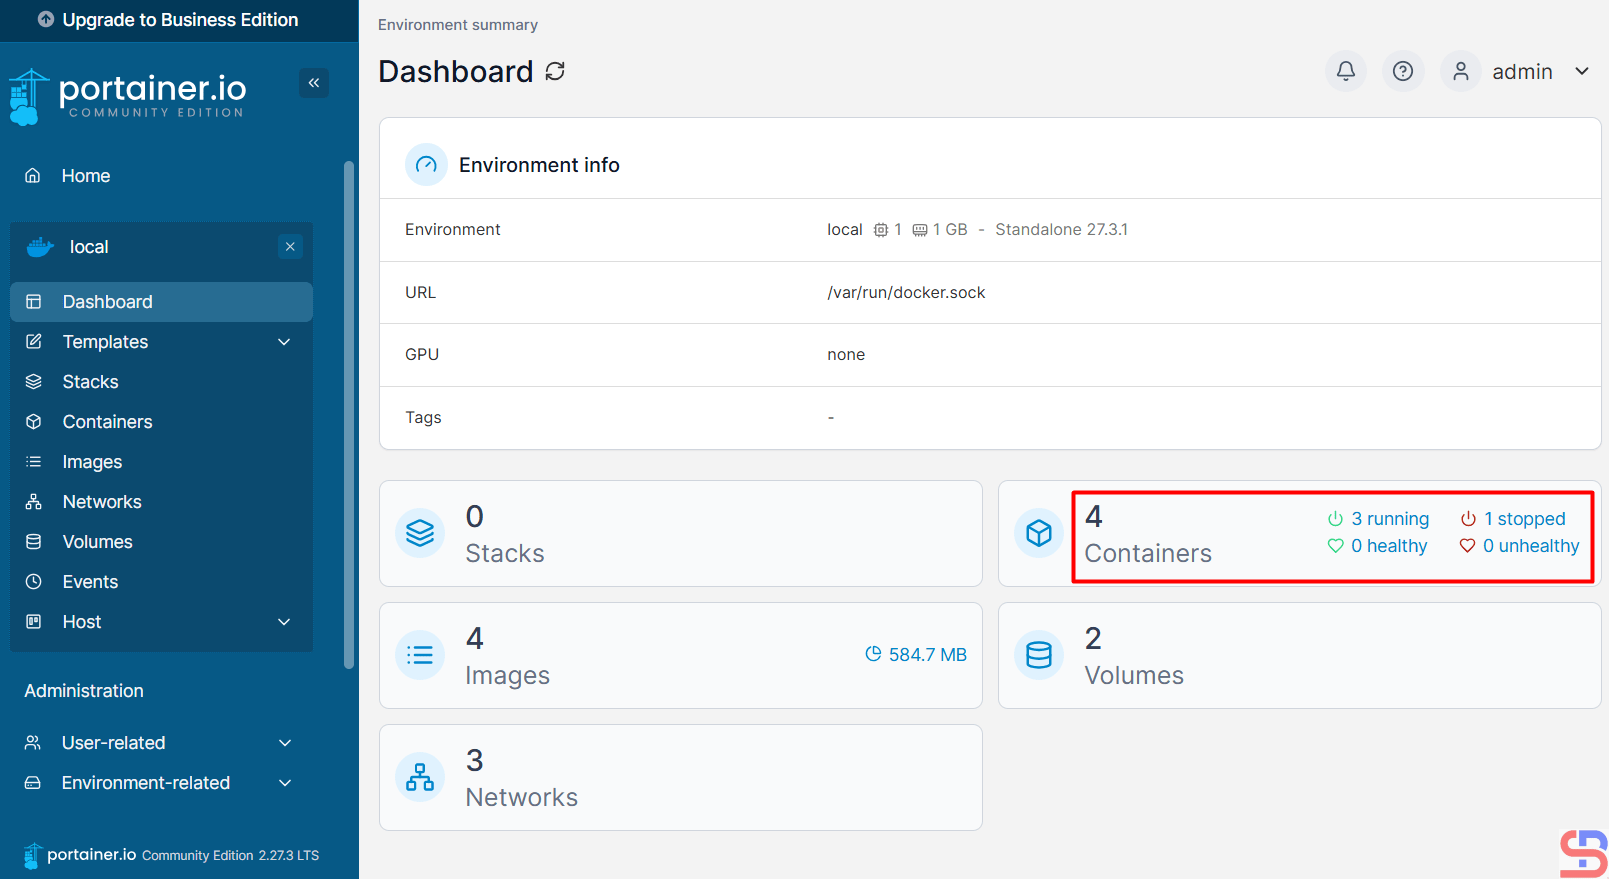
I have 4 containers in my server, but I want to detail each container, so I click in the red box, and there will be an image below:

If I want to display the resource of the Redis instance, click the icon in the red box, and there will be a display below:

If I want to access a container, I click the icon like in the red box:

There will be a display like in the image below:

Select the command used in the container and select the desired user. After that, click the Connect button, and there will image like in the image below:

You can access the inside of the container and give the Linux command from your browser to the container. From this tool, you can see the images in your Docker when you click Images, like in the image below:

You can display the Volume in Docker after you click the Volumes, like in the image below:
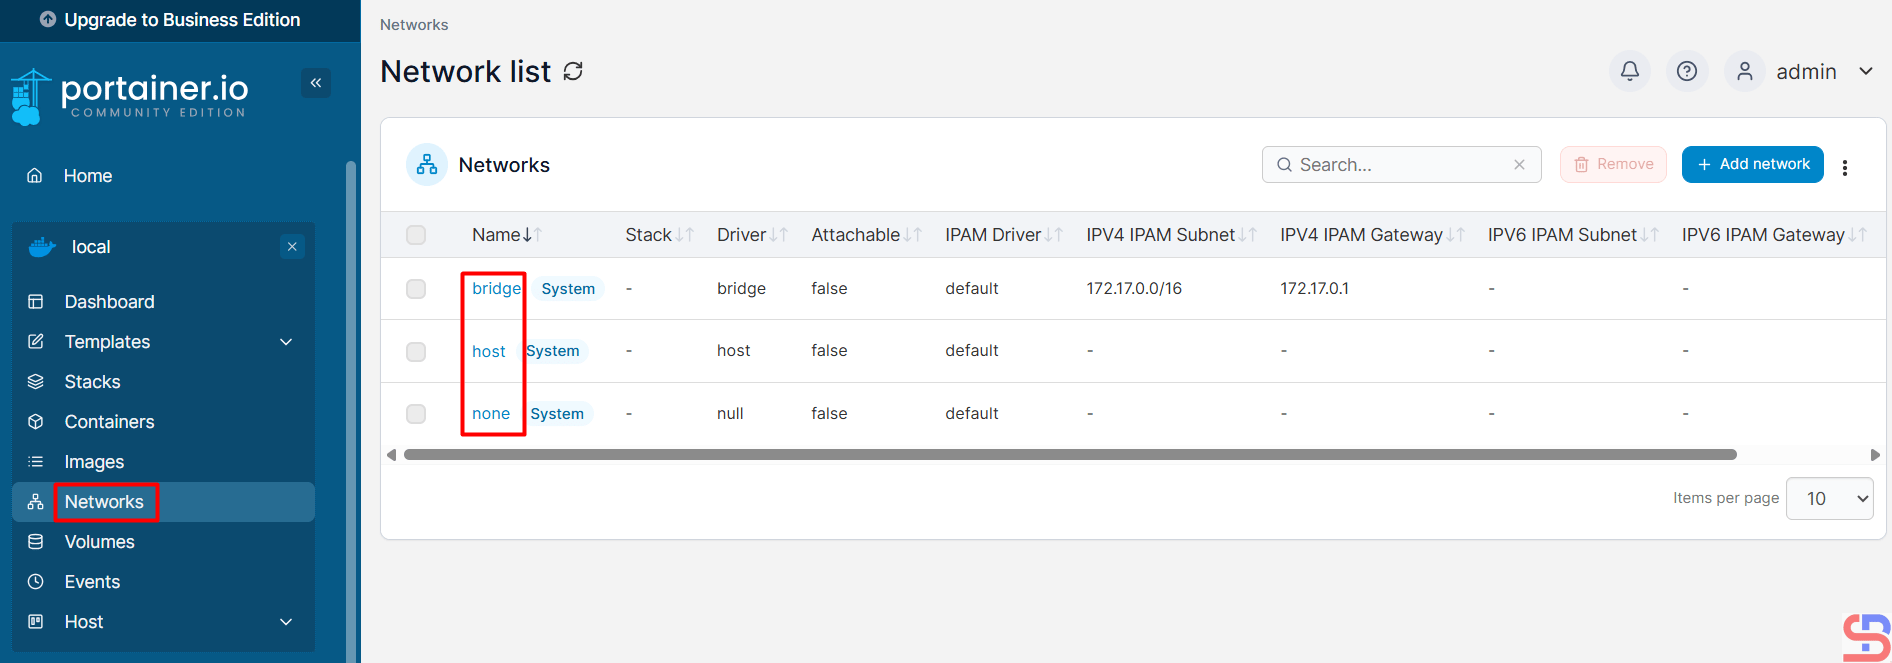
Note
If you want to monitor Docker on another server using Portainer, you have to install the agent using the command below:
curl -L https://downloads.portainer.io/agent-stack.yml -o agent-stack.yml && docker stack deploy --compose-file=agent-stack.yml portainer-agent
References
youtube.dimas-maryanto.com
docs.portainer.io
phoenixnap.com
musaamin.web.id
letscloud.io