The previous article explained how to install the Nagios application on Ubuntu. This article will explain how to install the Nagios application on RockyLinux.
Problem
How to install Nagios on RockyLinux?
Solution
Below are the steps to install Nagios on RockyLinux and work on RockyLinux 9.5 and below. But I think these steps should apply to installing Nagios on RHEL and its derivatives, such as CentOS, AlmaLinux, and so on.
1. Download the packages
Install the packages needed to install Nagios using the command below:
yum install -y httpd php php-devel gcc glibc glibc-common gd gd-devel make net-snmp-* wget zip unzip php-mysqlnd php-mysql*
2. Create a user and a group
Create a user and group for Nagios using the commands:
useradd nagios
groupadd nagcmd
usermod -G nagcmd nagios
usermod -G nagcmd apache
3. Download Nagios
Use the commands below to download Nagios, where at the time of this writing (February 2025), the latest version of Nagios is version 4.5.9:
cd /tmp
wget https://github.com/NagiosEnterprises/nagioscore/archive/refs/heads/master.zip -O nagios.zip
unzip nagios.zip
cd nagioscore-master/
4. Install Nagios
By default, Linux will create a Nagios folder in the /usr/local folder to save Nagios configuration files. So, use the following commands to install Nagios:
./configure
After that, run the following commands:
make all
make install
make install-init
make install-commandmode
make install-config
make install-webconf
5. Create the password
Create a password for the user to access the Nagios application. Usually, nagiosadmin is a popular username for Nagios, but you can create another username.
htpasswd -c /usr/local/nagios/etc/htpasswd.users nagiosadmin
6. Download Nagios Plugins
Plugins are compiled executables or scripts (Perl, shell, Python, PHP, Ruby, etc.) that can be run from a command line to check the status of a host or service. Nagios Core uses the results from plugins to determine the current status of hosts and services on your network. As of this writing (February 2025), the latest version of Nagios plugins is version 2.4.12. You can check the latest version of Nagios plugins on this site. Run the following commands to download Nagios plugins:
cd /tmp
wget https://github.com/nagios-plugins/nagios-plugins/archive/refs/heads/master.zip -O nagios-plugins.zip
unzip nagios-plugins.zip
cd nagios-plugins-master/
7. Install Nagios Plugins
After that, install Nagios plugins using the following commands:
./tools/setup
sudo ./configure --with-nagios-user=nagios --with-nagios-group=nagios
sudo make
sudo make install
8. Check the configuration
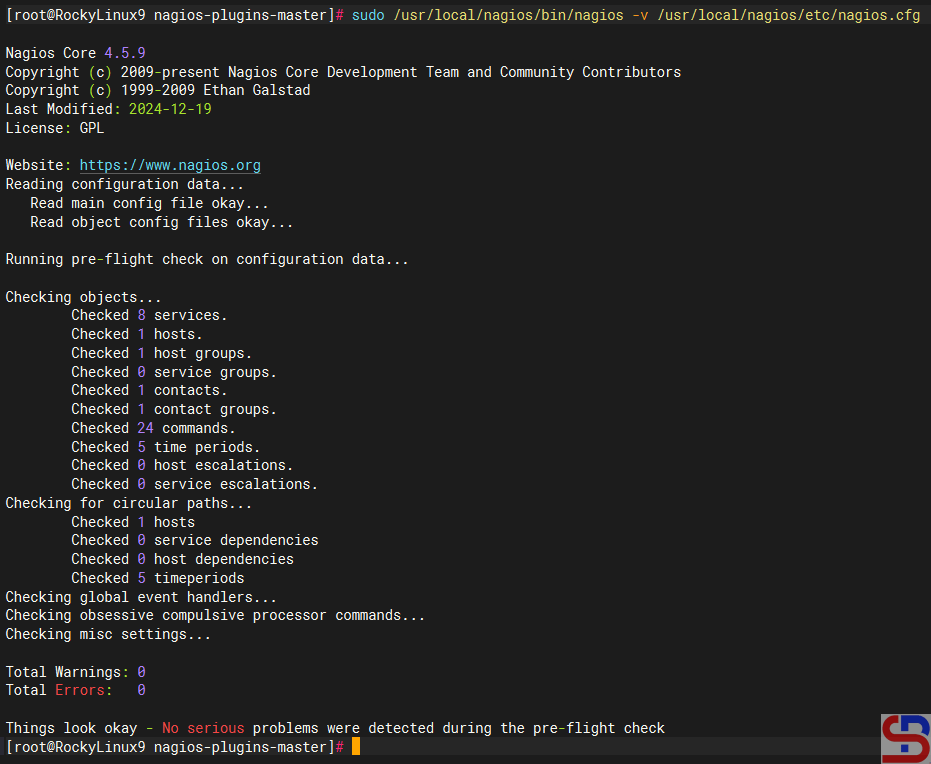
After installing Nagios and Nagios plugins, run the following command to check the configuration of Nagios:
/usr/local/nagios/bin/nagios -v /usr/local/nagios/etc/nagios.cfg
and make sure there is no error like in the image below:
9. Turn on the services
Turn on the services using the commands below:
cp /lib/systemd/system/nagios.service /etc/systemd/system/
systemctl start httpd
systemctl start nagios
systemctl enable httpd
systemctl enable nagios
10. Check the application
Open your browser, and type in your browser:
http://your_ip_address_server/nagios
And there should be a display like the image below:
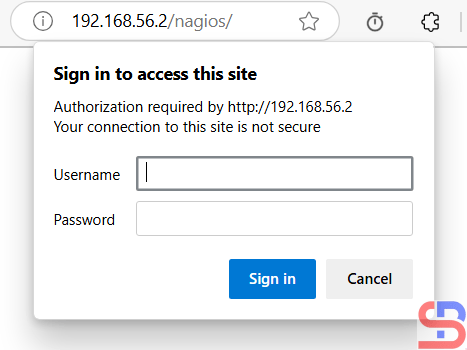
If you don’t see the image like the above image in your browser, maybe the Firewall/IPTables is still on in your server. Run the following commands:
firewall-cmd --zone=public --add-port=80/tcp --permanent
firewall-cmd --reload
sed -i 's/SELINUX=.*/SELINUX=disabled/g' /etc/selinux/config
setenforce 0
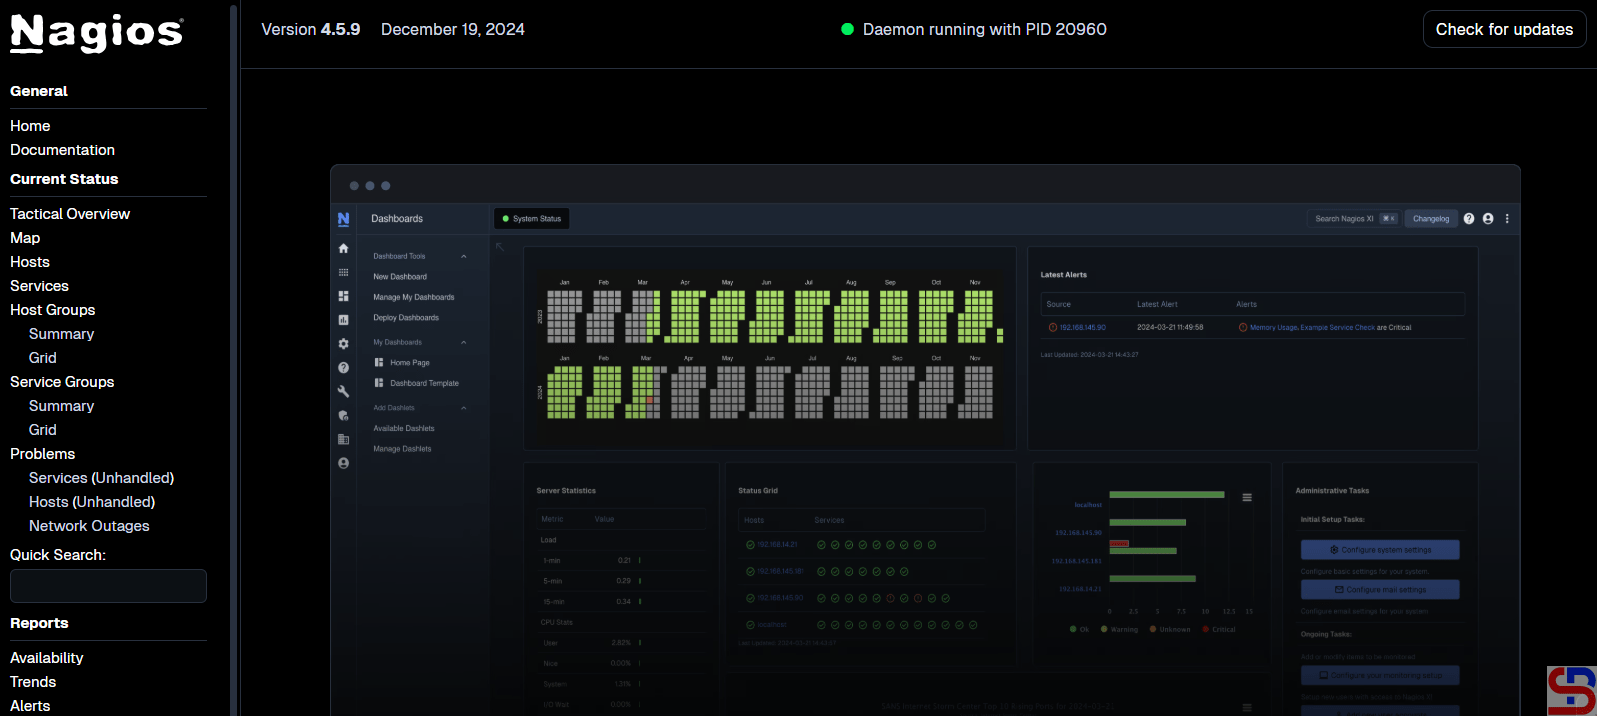
Back to your browser again, and it should work now. Insert the username (nagiosadmin) and the password for Nagios. If the username and the password are right, the Nagios application will appear like this:
If you want to know which hosts are being monitored by Nagios, click Hosts. Nagios will display the hosts that are being monitored:
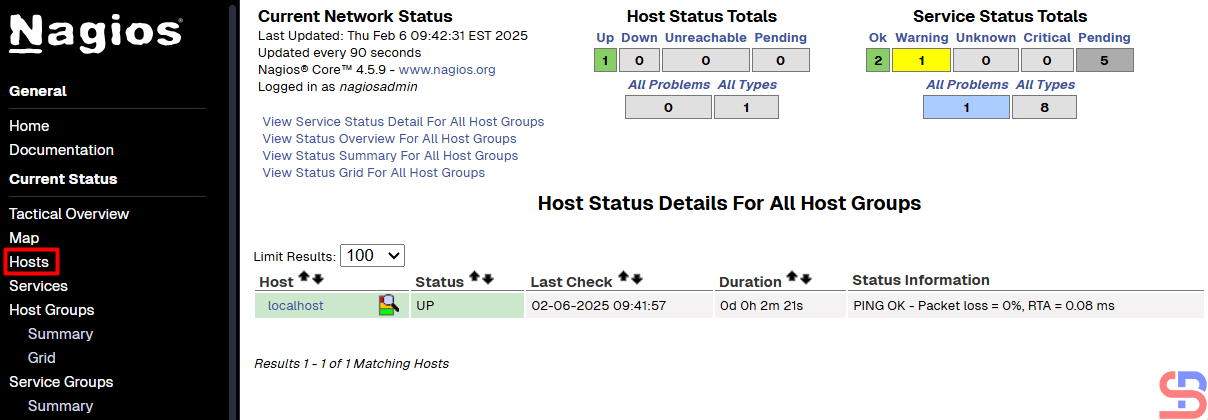
From the picture above, it can be seen that currently, Nagios is only monitoring the Nagios server or localhost. If you want to know which services are being monitored by Nagios, click Services. Nagios will display the services that are being monitored:
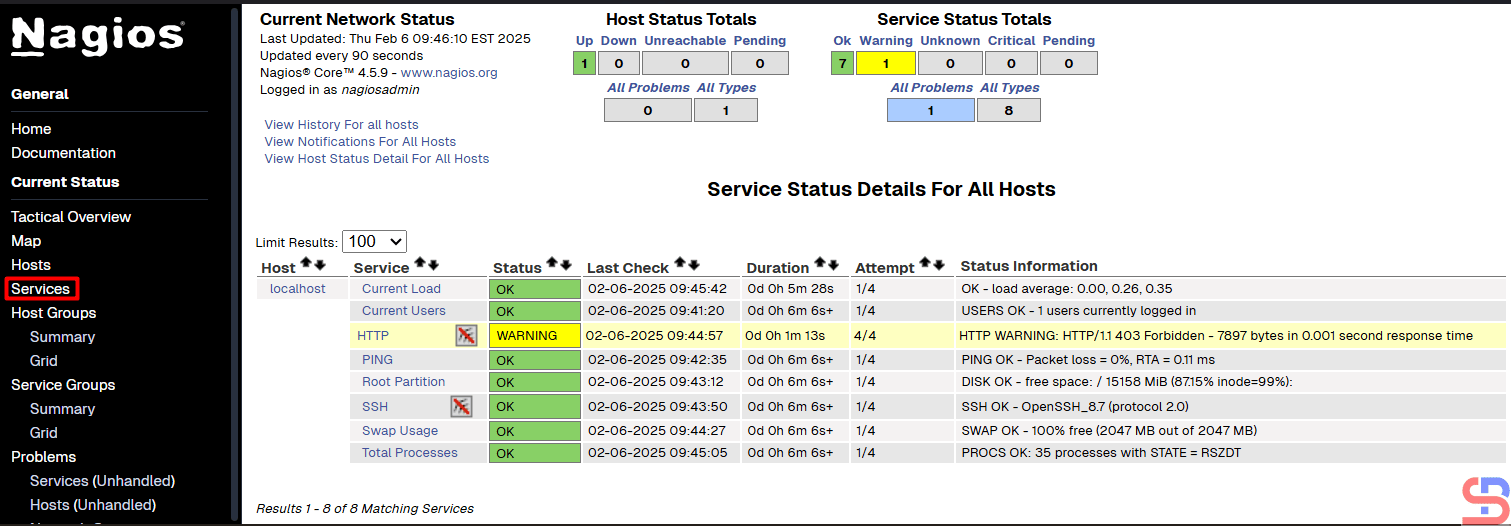
From the picture above, you can see that Nagios monitored 8 services for the Nagios server or localhost.
Note
If you have a domain/subdomain and want to use that domain/subdomain for the Nagios application, create a virtual host on your web server. For example, I have the domain sysadminpedia.com and want to use the subdomain nagios.sysadminpedia.com for the Nagios application. So, I created the script below in the file /etc/httpd/conf.d/nagios.sysadminpedia.com.conf:
<VirtualHost *:80>
    ServerName nagios.sysadminpedia.com
    ServerAdmin sysadmin@nagios.sysadminpedia.com
    DocumentRoot /usr/local/nagios/share
    <Directory /usr/local/nagios/share>
         Options -Indexes +FollowSymLinks
         AllowOverride All
    </Directory>

    ErrorLog /var/log/httpd/nagios.sysadminpedia.com-error.log
    CustomLog /var/log/httpd/nagios.sysadminpedia.com-access.log combined
</VirtualHost>
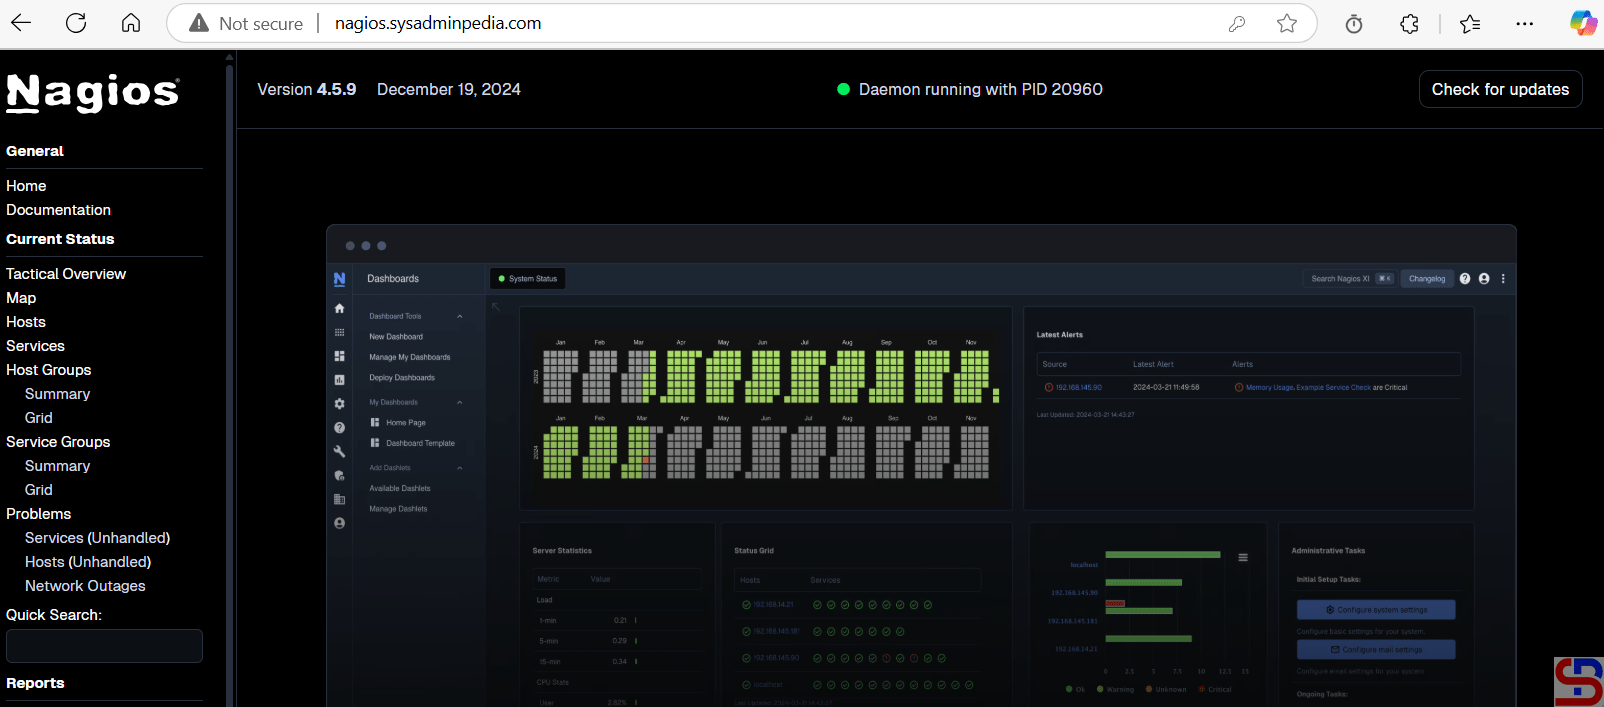
Restart the web server, open your browser, and type your domain/subdomain for Nagios, and it should be like the image below:
References
support.nagios.com
tecmint.com
statusengine.org

