How to Display the Results of a Script in Zabbix?
I want to create a monitoring to check if a site is in an error state or not using a script, and the results of this script will be sent to Zabbix for monitoring.
Problem
How to display the results of a script in Zabbix?
Solution
For example, I have a sysadminpedia.com site and want to monitor the site. The way I do monitoring is to look for wordpress writing on the site, and if the wordpress writing is not on the site, it means that the site has an error. I use a bash script to monitor the word on sysadminpedia.com. For the site to be monitored by Zabbix based on the results of the script I created, follow the steps below:
1. Create a script
Log in to the Zabbix server, and you can use any folder to create your script, but I created a special folder for scripts in Zabbix using the command:
sudo mkdir -p /etc/zabbix/scripts
Then create a bash script in a folder with the file name check-sysadminpedia-site.sh and copy the script below:
#!/bin/bash

# Fetch the website content
content=$(curl -s https://sysadminpedia.com)

# Check if the word "wordpress" exists (case-insensitive)
if echo "$content" | grep -iq "wordpress"; then
  echo 1
else
  echo 0
fi
2. Change the user, group, and permission
Change the user and group on the file using the command below:
chown -R zabbix:zabbix /etc/zabbix/scripts/check-sysadminpedia-site.sh
After that, type the following command to make the script run:
chmod +x /etc/zabbix/scripts/check-sysadminpedia-site.sh
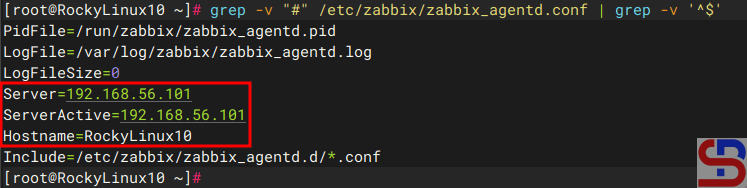
3. Configure in the zabbix_agent file
Add the below script in the file /etc/zabbix/zabbix_agentd.conf:
UserParameter=check-sysadminpedia-site,/etc/zabbix/scripts/check-sysadminpedia-site.sh
4. Restart zabbix_agent
Restart the Zabbix agent using the following commands:
systemctl daemon-reload
systemctl restart zabbix-agent
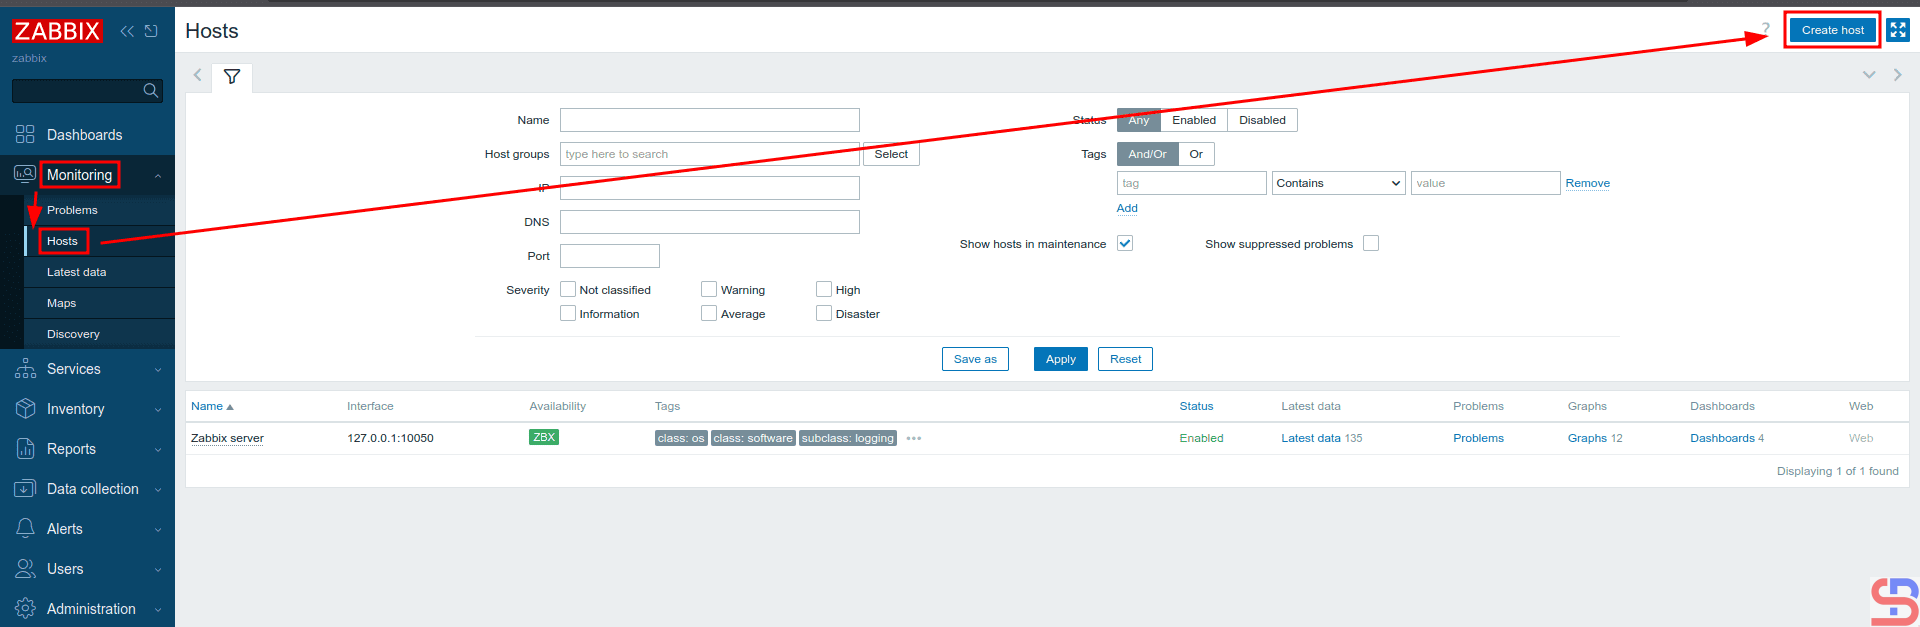
5. Configure Zabbix
Go to your Zabbix application, select the Host you want to enter to display the results of this monitoring in Zabbix. I choose to use the Zabbix server host: Monitoring > Hosts > Zabbix server > Items in the CONFIGURATION like in the image below:

And there will be a display like the following:

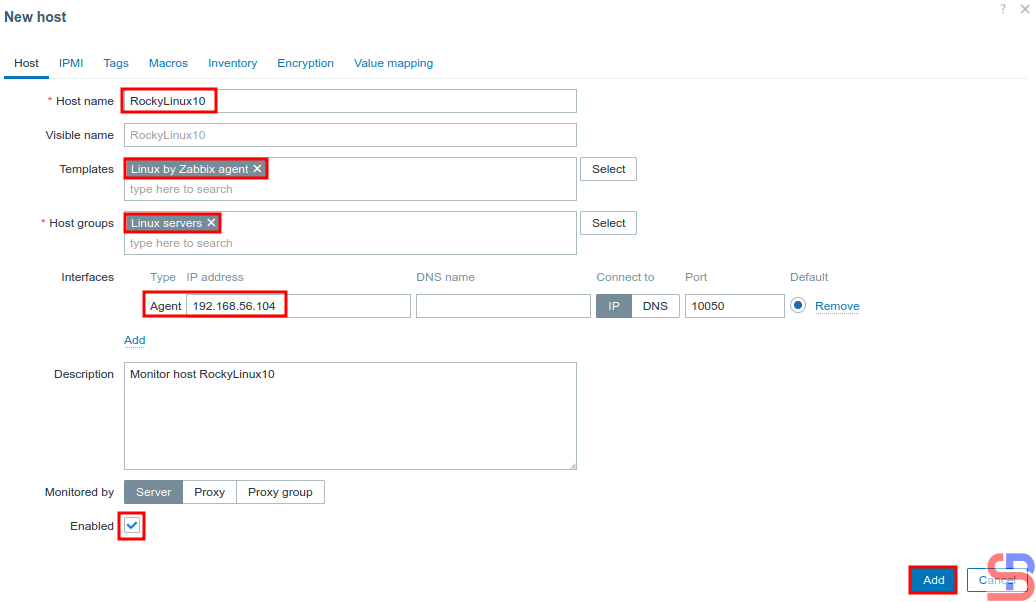
Click the Create item button, and then there will be a display as shown below:

I fill in the fields as in the image above, click the Test button, and then there will be a display as in the image below:

Click the Get value and test button, and in the Value section, there will be a value generated, either it is 1 or 0, according to the value in the bash script, as in the image below:

You see from the image above, the Value is 1. Click the Cancel button, then it will return to the previous view, like the image below:

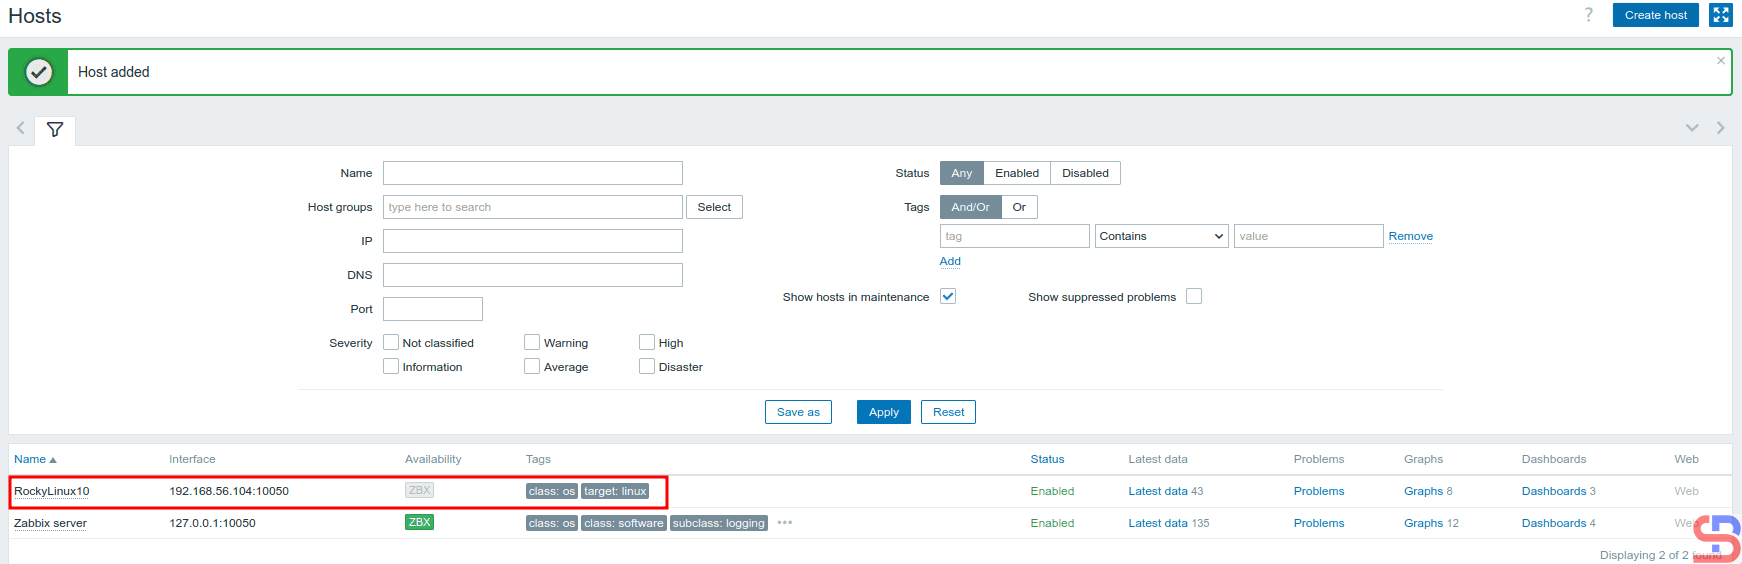
After you press the Add button, there will be the text Item added as in the image below:

6. Create a graph
Then, create a graph for the result of the script by selecting the host that will display the result of the bash script. I choose to use the Zabbix server host: Monitoring > Hosts > Zabbix server > Graphs in the CONFIGURATION section, like the image below:

And there will be a display as shown in the image below:

Click Create Graph, then there will be a display as below:
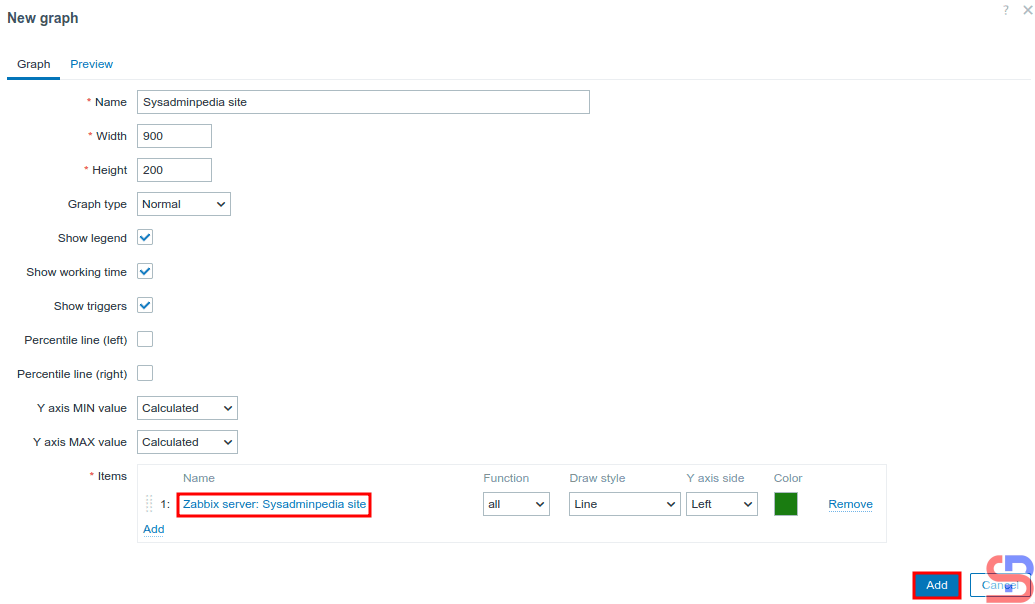
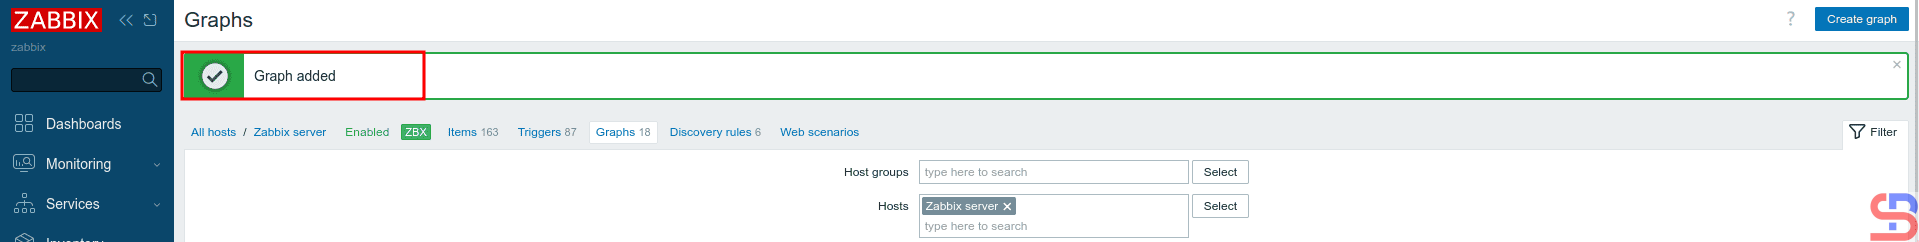
After that, click the Add button then there will be the text Graph Added as in the image below:
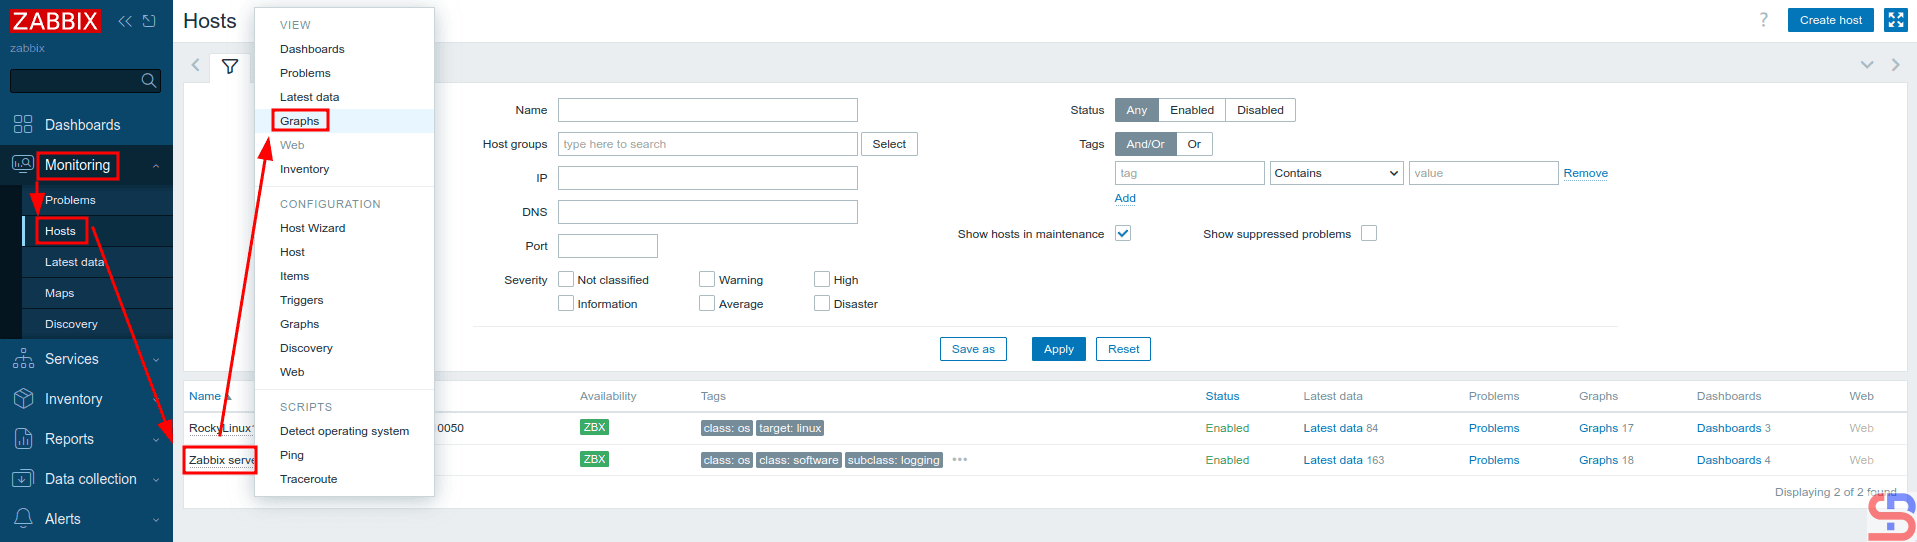
7. Display the graph
Wait a while, and to see the graph, you can go to Monitoring > Hosts > Zabbix server > Graphs in the View section, as shown in the image below:
Click the Filter button as shown in the image below:

Then there will be a display as shown in the image below:
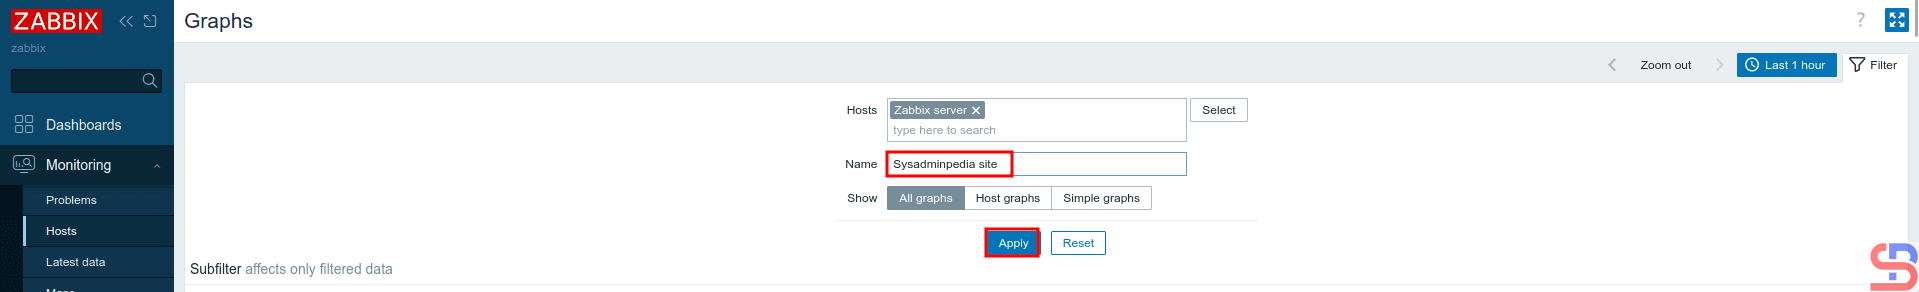
Type the name of the graph in the Name field, then click Apply, and then there should be a display below:
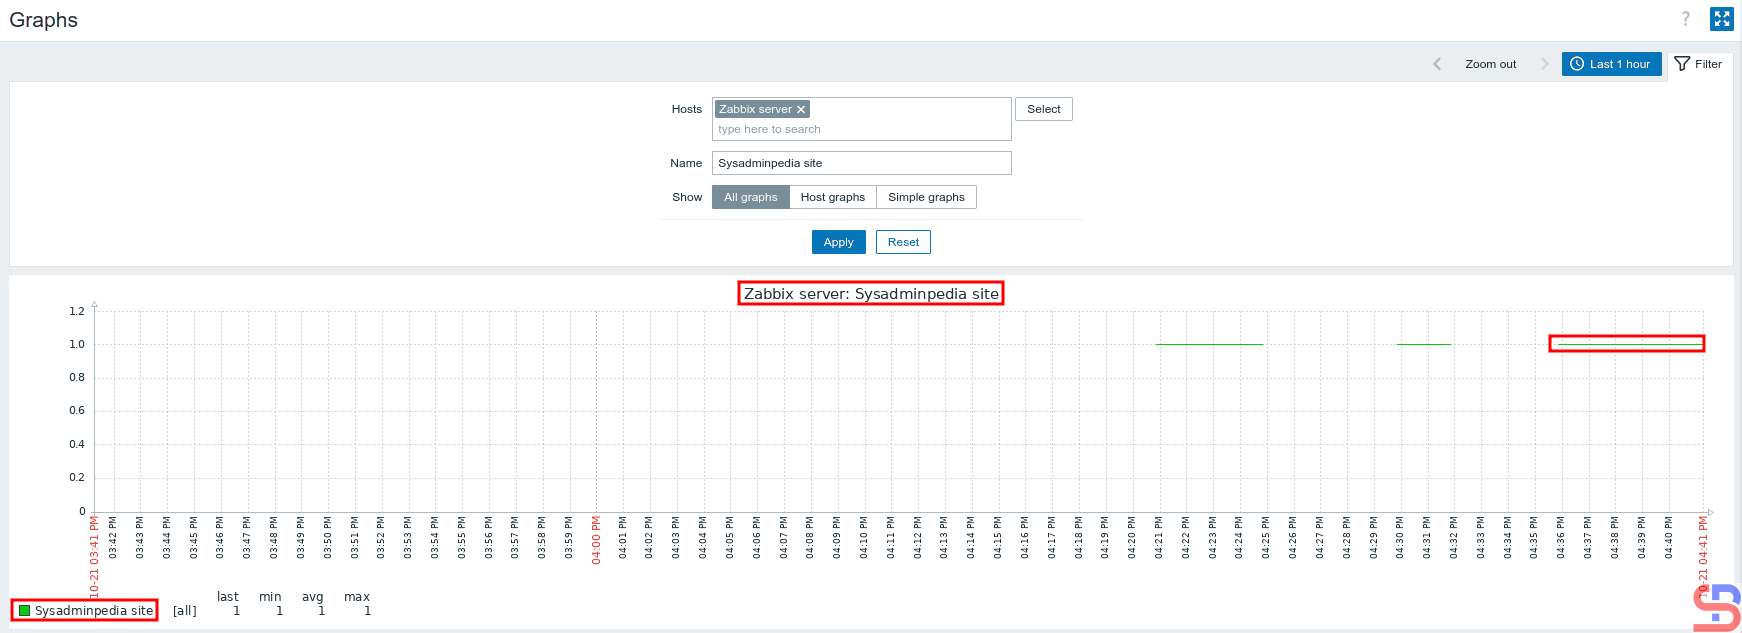
If the site has an error, as known as there is no word wordpress, the graph will look as below:

And you successfully created a graph in Zabbix from the result of a script you made yourself.
Note
In this article, I used the Zabbix server to insert a script that monitors the server. However, you can use another host for your script, so you can do points 1 to 4 in the explanation above on another host.