The previous article explained how to install the Zabbix application on Ubuntu. This article will explain how to add a Linux host to be monitored by Zabbix.
Problem
How to add a Linux host to be monitored by Zabbix?
Solution
This article will add a RockyLinux10 host, which will be monitored by Zabbix with IP 192.168.56.104, while the Zabbix server IP is 192.168.56.101. So that the host can be monitored by Zabbix, you must install the Zabbix-Agent on the host. Here are the steps:
A. On Remote Host
Check whether on your RockyLinux server, you have the file /etc/yum.repos.d/epel.repo. Don’t worry if your server does not have the epel.repo file, but if the file exists on your server, you can add the script below:
excludepkgs=zabbix*
After that, run the commands below:
rpm -Uvh https://repo.zabbix.com/zabbix/7.4/release/rocky/10/noarch/zabbix-release-latest-7.4.el10.noarch.rpm
dnf clean all
dnf install zabbix-agent -y
After you install the zabbix agent, go to copy the file /etc/zabbix/zabbix_agentd.conf as a backup:
cp /etc/zabbix/zabbix_agentd.conf /etc/zabbix/zabbix_agentd.conf.ori
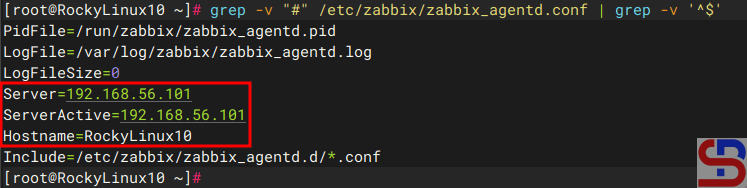
Then go into the file and change the Server section to your Zabbix server IP (which in this article is IP 192.168.56.101), and in the Hostname section, you are free to fill in, and I changed it to RockyLinux10, so the file looks like the one below:
If your RockyLinux server has a firewall, open port 10050 using the command:
firewall-cmd --permanent --zone=public --add-port=10050/tcp
firewall-cmd --reload
Then run the two commands below:
systemctl restart zabbix-agent
systemctl enable zabbix-agent
To view the log on zabbix-agent, open the file /var/log/zabbix/zabbix_agentd.log on your server.
B. On the Zabbix server
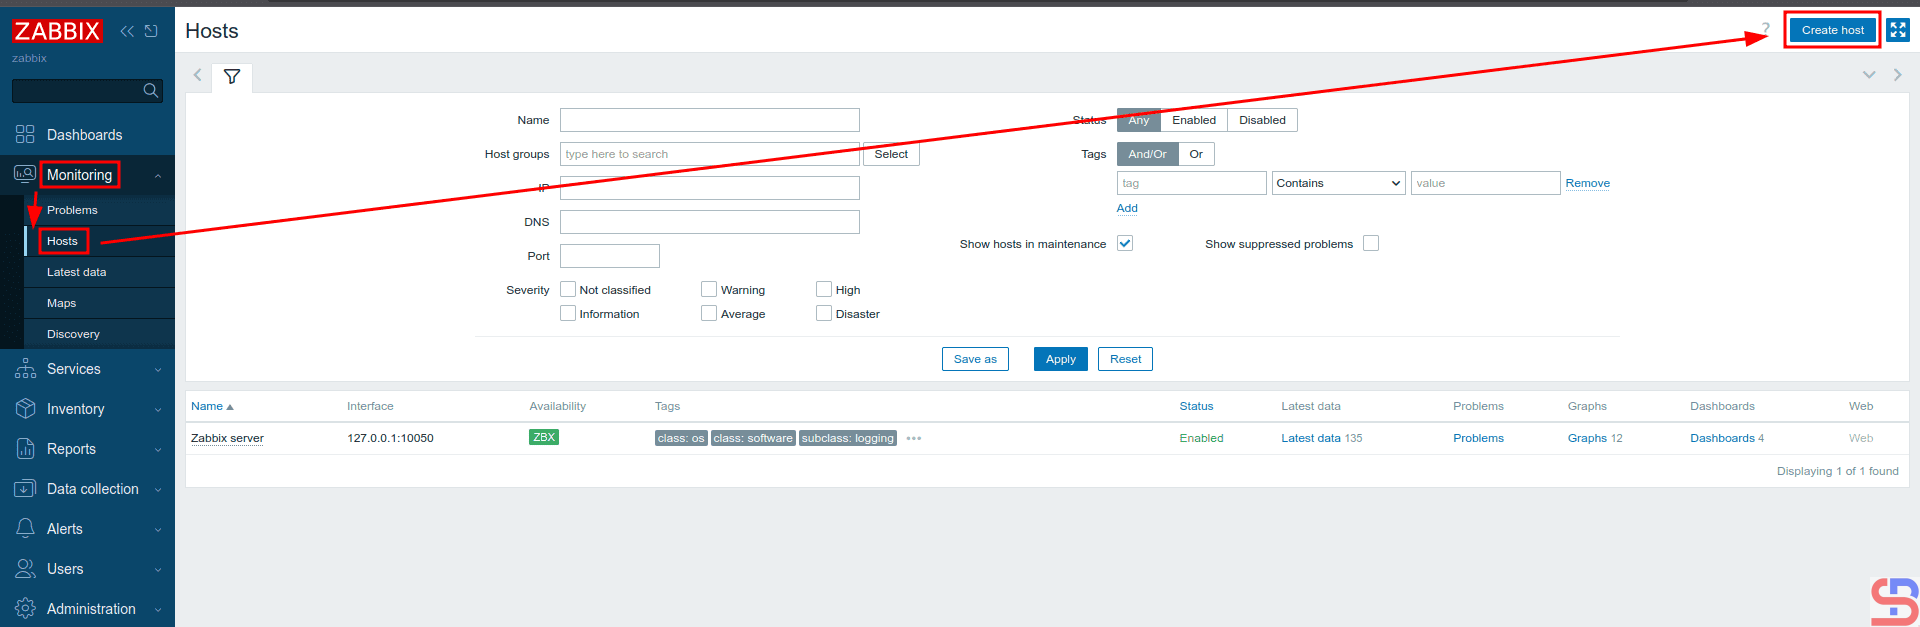
On the Zabbix server, enter the Zabbix application via your browser, then select Monitoring > Hosts > Create Host as in the image below:
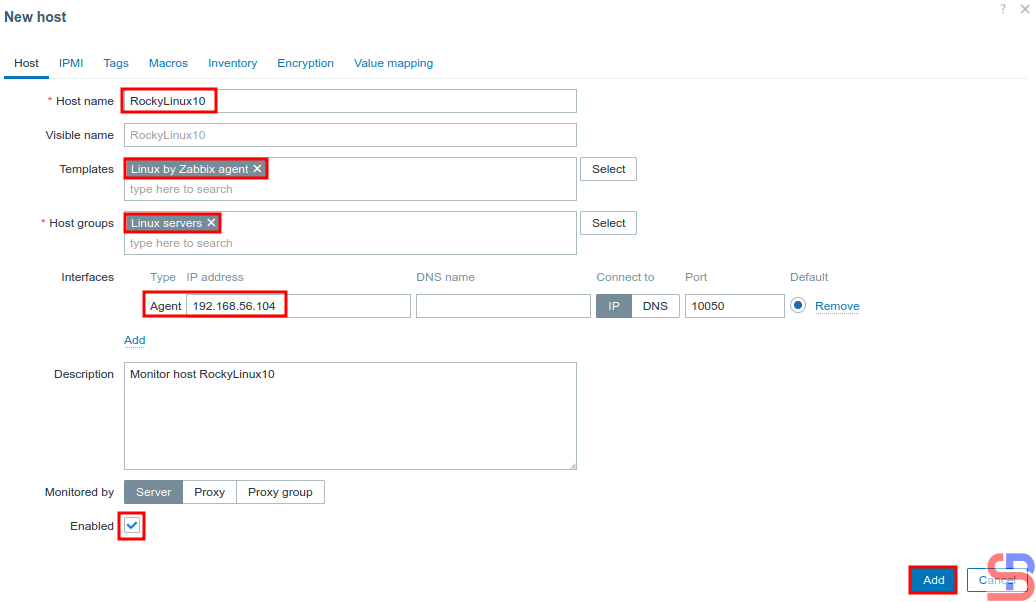
After that, there will be a display like below. You have to fill in the columns according to the host you will monitor. I filled them in as shown in the image below:
When finished, click the Add button, and you will see a display like the one below:
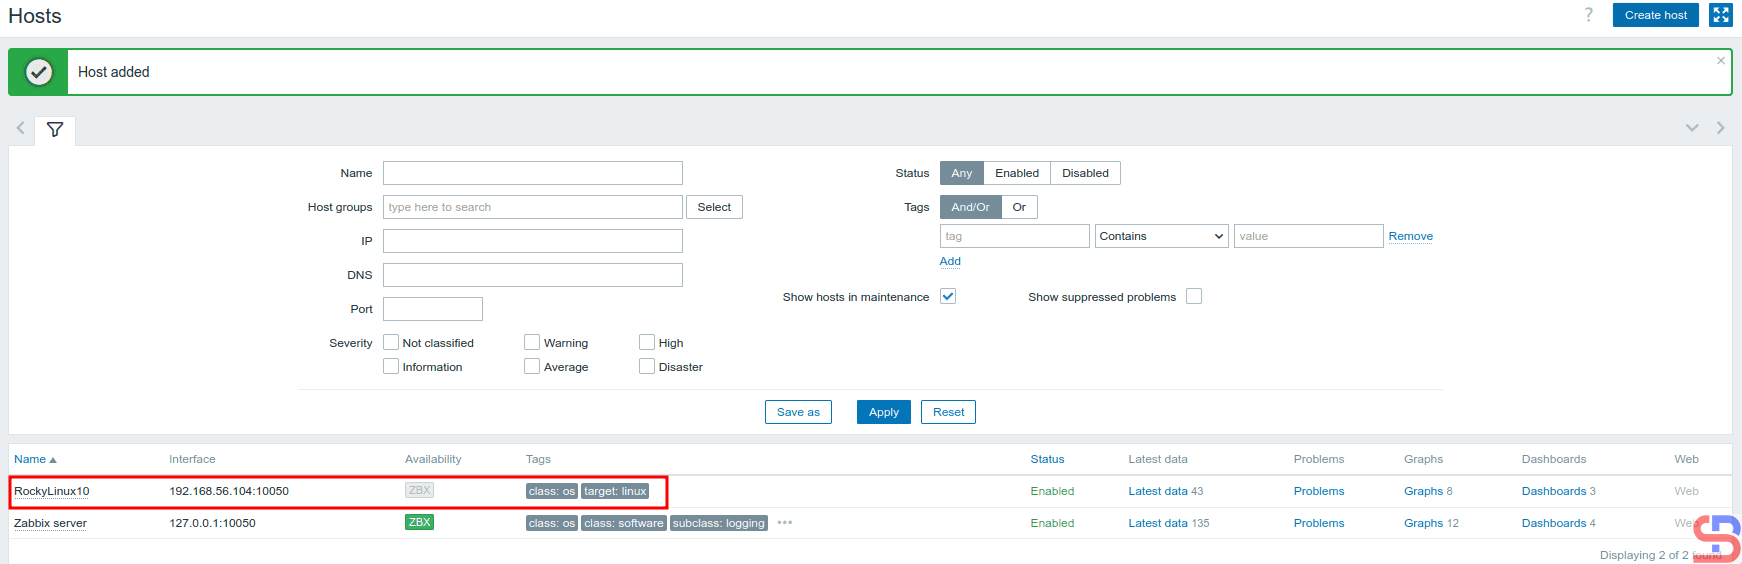
Wait a few moments, and the Zabbix application should be able to monitor your host, which is marked with the word ZBX in green, as in the image below:

To see the graph of the host, click on the words Graphs, so there will be a display like the one below:

And you have successfully added a host to the Zabbix application.
Note
If you want to add a host that Zabbix wants to monitor, you can go to this address to see the steps to install the Zabbix agent on your server. Make sure the Zabbix version selected is the same as the Zabbix version running on the server. The following is an example image for installing the Zabbix agent on the RockyLinux10 host, which is used as an example in this article:
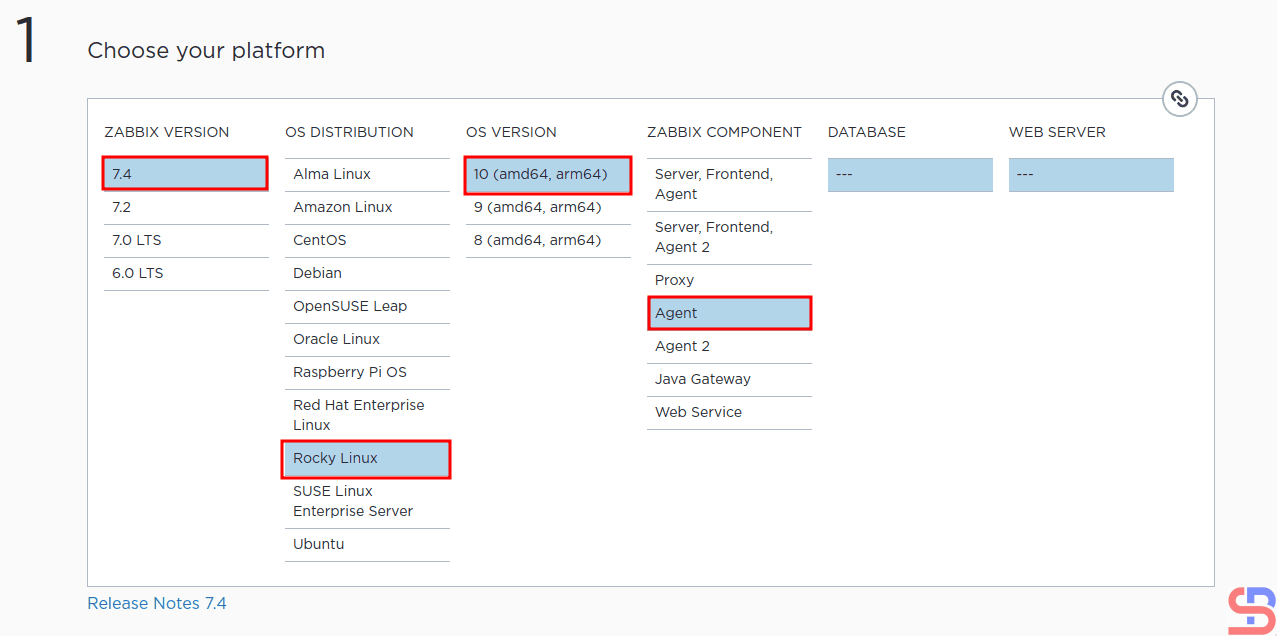
And don’t forget to open Port 10050 on the host you want to monitor so that the Zabbix application can access that host.
References
tecadmin.net
zabbix.com
bestmonitoringtools.com

