How to Install Zabbix On Ubuntu?

Zabbix is an open-source software tool to monitor IT infrastructure such as networks, servers, virtual machines, and cloud services.


Problem

How to install Zabbix in Ubuntu?


Solution

Zabbix was first released in 2001, and as of this writing in October 2025, Zabbix has version 7.4. This article will explain how to install Zabbix on an Ubuntu server by using MariaDB and Apache databases.

A. Install Zabbix

Run the commands below to install Zabbix on Ubuntu:

wget https://repo.zabbix.com/zabbix/7.4/release/ubuntu/pool/main/z/zabbix-release/zabbix-release_latest_7.4+ubuntu24.04_all.deb
sudo dpkg -i zabbix-release_latest_7.4+ubuntu24.04_all.deb
sudo apt update
sudo apt install zabbix-server-mysql zabbix-frontend-php zabbix-apache-conf zabbix-sql-scripts zabbix-agent


B. Database Configuration

If your Ubuntu doesn’t have a database, then you can use the MariaDB database by using the command:

sudo apt install mariadb-server


Then, create a password for root in MariaDB using the command:

sudo mariadb-secure-installation 


After that, enter MariaDB using the command:

sudo mariadb -uroot -p


Run the commands below (change the password to what you want):

create database zabbix character set utf8mb4 collate utf8mb4_bin;
create user zabbix@localhost identified by 'password';
grant all privileges on zabbix.* to zabbix@localhost;
set global log_bin_trust_function_creators = 1;
quit; 


Run the command below to import the initial schema and data, and enter the password you created when you created the Zabbix database in MariaDB:

zcat /usr/share/zabbix/sql-scripts/mysql/server.sql.gz | mysql --default-character-set=utf8mb4 -uzabbix -p zabbix 


Then log in to MariaDB again using the command:

sudo mariadb -uroot -p


Run the command below to disable the log_bin_trust_function_creators option after importing the database schema.

set global log_bin_trust_function_creators = 0;
quit; 


C. Configure the Zabbix file

After that, you will configure the zabbix file located in /etc/zabbix/zabbix_server.conf. It’s better if you copy the original file as a backup by running the command below:

sudo cp /etc/zabbix/zabbix_server.conf /etc/zabbix/zabbix_server.conf.ori


Fill in the DBPassword section of the file with the password you created for the Zabbix user, so that it is as follows:

Configuration on zabbix_server.conf file


Then run the two commands below:

systemctl restart zabbix-server zabbix-agent apache2
systemctl enable zabbix-server zabbix-agent apache2


D. Configure Zabbix

Open your browser and type in the URL below:

http://your_ip_server/zabbix


Then there will be a display like the image below:
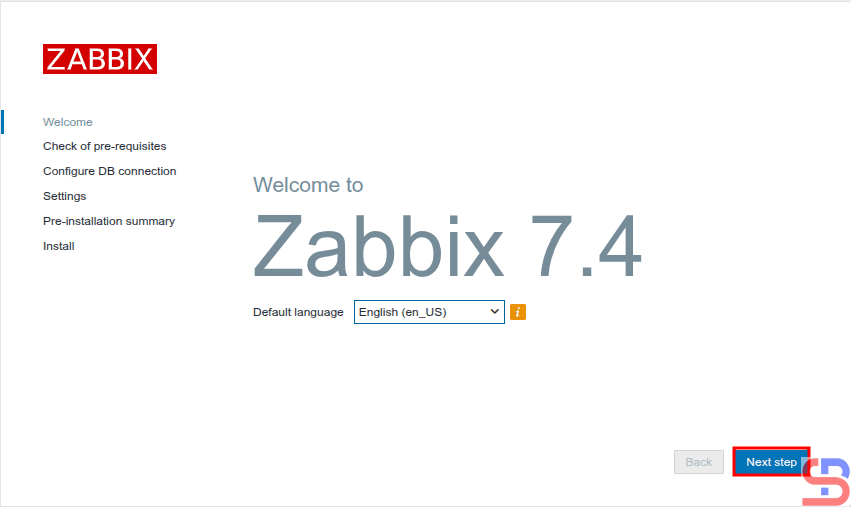
Configure Zabbix using your browser


Click the Next step button, and a display similar to the picture below will be present:
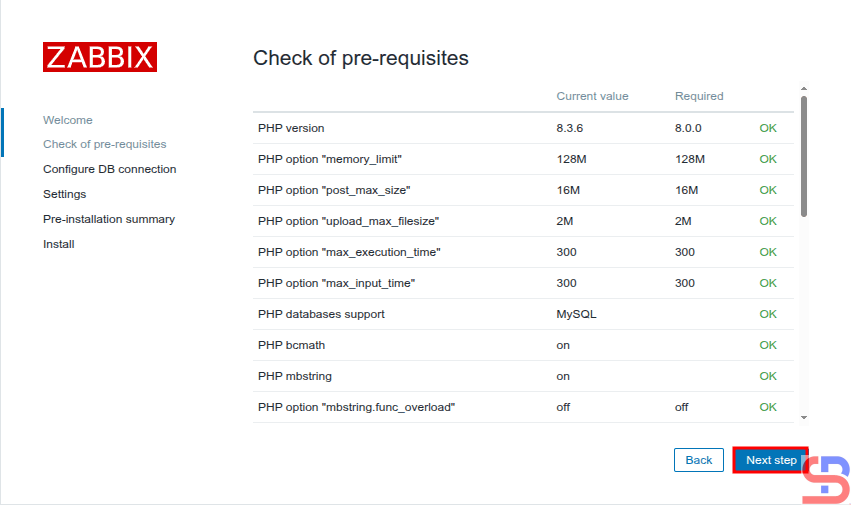
Checking of pre-requisites


Make sure there is no error like in the image above. After that, click the Next step button, and there will be a screen similar to the one below:
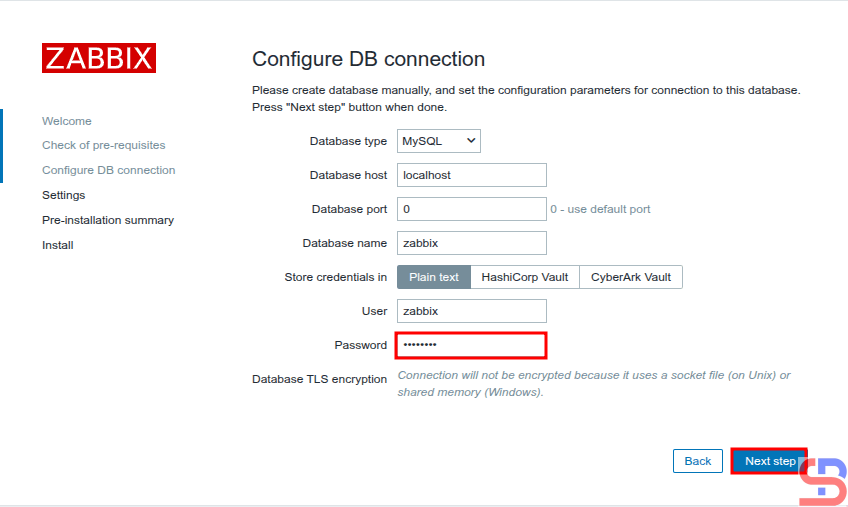
Enter the password of MariaDB


Enter your database password using the Zabbix user, click the Next step button, and a screen similar to the one below will be presented:
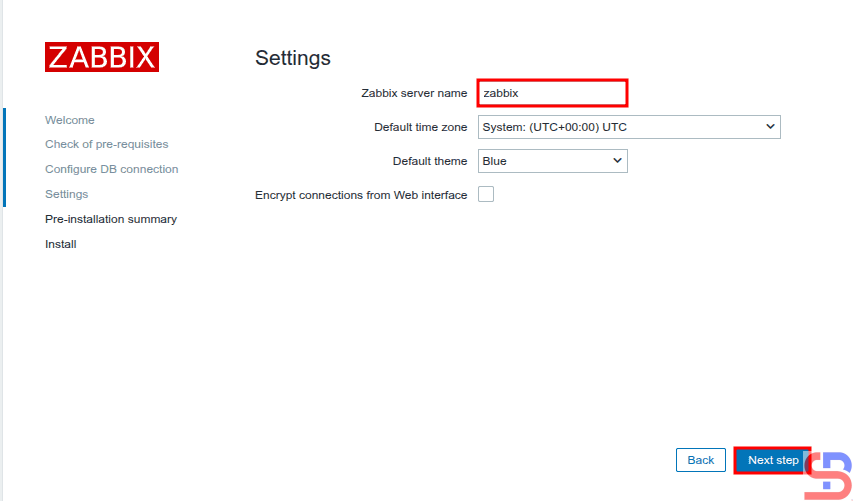
Enter the server name of Zabbix


Enter the name of the Zabbix server you want, click the Next step button, and there will be a display like the image below:

install Zabbix in Ubuntu
Pre-installation summary


Click the Next step button, and there will be a display similar to the image shown below.
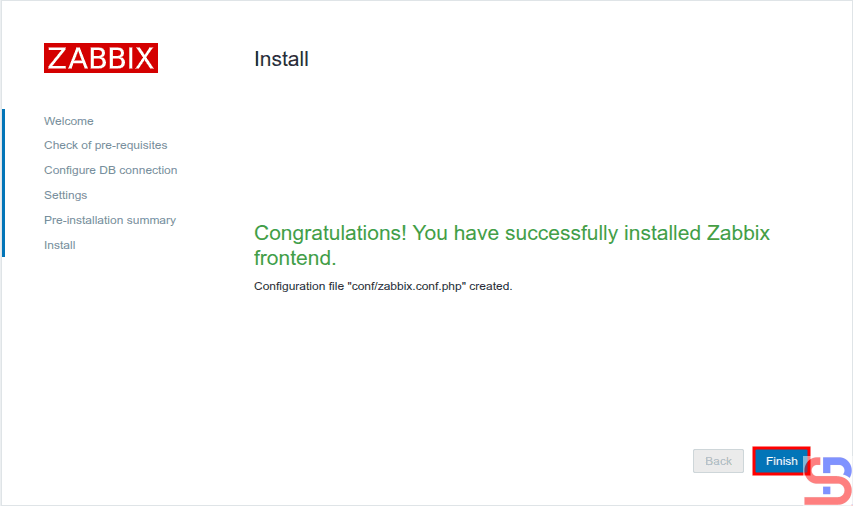
install Zabbix in Ubuntu
Finish installation


Click the Finish button, and a screen like the one shown below will appear.

install Zabbix in Ubuntu
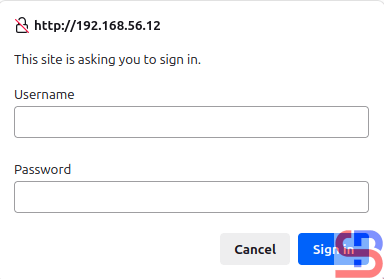
Enter the username and password of Zabbix


For your information, the initial username for Zabbix is Admin and the initial password is zabbix. After you enter the username and password, click the Sign in button, and there will be a display like the image below:
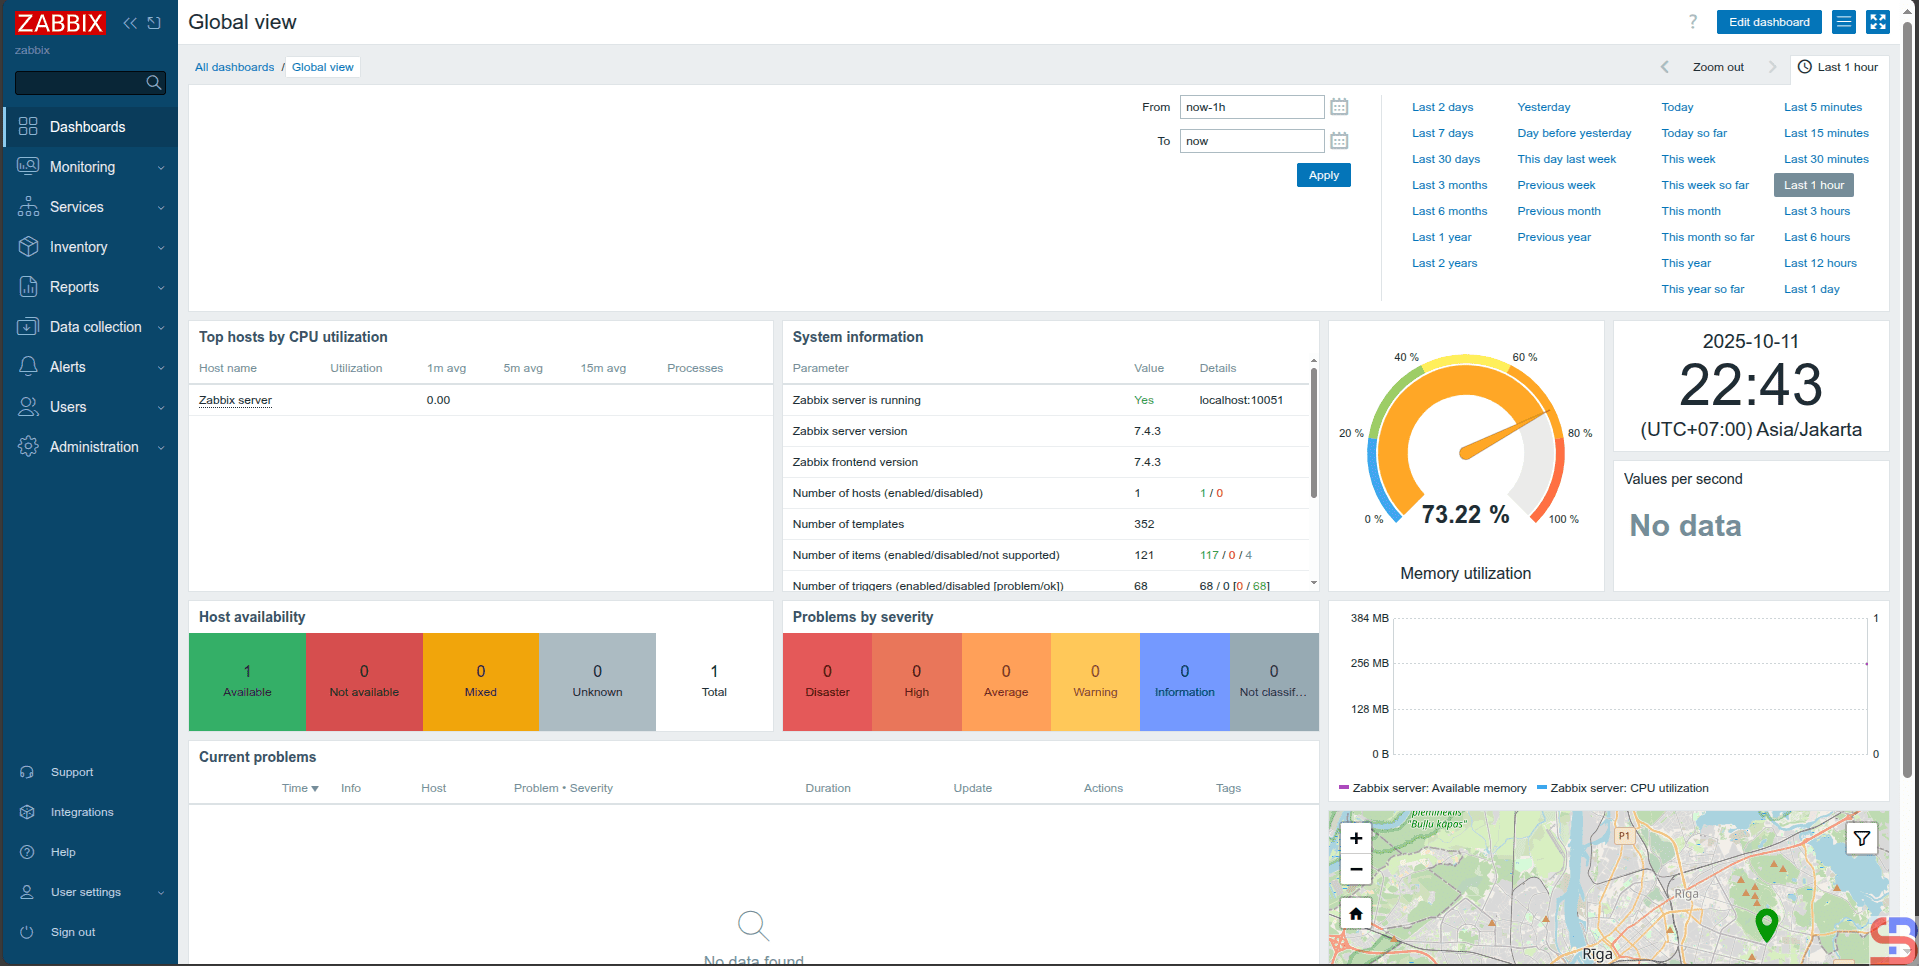
install Zabbix in Ubuntu
The initial display of Zabbix


You have successfully installed the Zabbix application on your Ubuntu server.


Note

To install Zabbix on a different operating system, you can go to this page to see how to install Zabbix on your server.
 

References

en.wikipedia.org
zabbix.com
medium.com


How to Install NagiosQL in Ubuntu/Debian?

After you install the Nagios application on the Ubuntu/Debian server, by default, Nagios Core does not provide a web-based interface to manage Nagios configuration for adding/deleting/changing hosts and services. Therefore, some developers create a web-based interface so users can manage the hosts and services easily. This article will explain how to install the NagiosQL application to set up the device or service on Nagios.


Problem

How to install NagiosQL in Ubuntu/Debian?


Solution

NagiosQL is a professional, web-based configuration tool for Nagios 2.x/3.x/4.x and other Nagios-based monitoring tools. It is designed for large enterprise requirements as well as small environments, and any Nagios functionality is supported. I ran the steps below in Ubuntu 24.04, and I think it will work in Debian too. Here are the steps to install the NagioSQL application, and 

A. Install the dependencies

Use the following command to install the dependencies:

sudo apt update
sudo apt-get install -y php libmcrypt-dev php-cli php-gd php-curl php-mysql php-ldap php-zip php-fileinfo php-pear gcc php-dev php zlib1g-dev libssh2-1 libssh2-1-dev php-ssh2  mariadb-server build-essential
sudo pear channel-update pear.php.net
sudo pear install HTML_Template_IT


B. Install PHP Modules

After that, install PHP Modules using the following command:

sudo pecl install mcrypt


C. Configure PHP

Type the following commands to configure PHP:

echo "extension=mcrypt.so" >> /etc/php/*/apache2/php.ini
echo "date.timezone=Asia/Singapore"  >> /etc/php/*/apache2/php.ini
sudo systemctl restart apache2


D. Configure the database

Start MariaDB and give the password using the following commands:

sudo systemctl start mariadb
sudo mariadb-secure-installation


Access to MariaDB using the following command:

mariadb -uroot -p


Type your root password and then run the following commands to create a database for NagiosQL:

CREATE DATABASE nagiosql;
GRANT ALL PRIVILEGES ON nagiosql.* TO `nagiosql_user`@`%` IDENTIFIED BY 'qwerty';
FLUSH PRIVILEGES;


E. Download NagiosQL

Download the latest release of the NagiosQL application, as of this writing (August 2025), has reached version 3.5.0, and configure it by typing the commands below:

cd /tmp/
wget https://sourceforge.net/projects/nagiosql/files/latest/download -O nagiosql.tar.gz
tar -zxvf nagiosql.tar.gz
sudo cp -vprf nagiosql-*/ /usr/local/nagios/share/nagiosql


F. Configure files and folders

Copy the commands below to configure files and folders:

sudo mkdir /usr/local/nagios/etc/nagiosql;
sudo mkdir /usr/local/nagios/etc/nagiosql/hosts;
sudo mkdir /usr/local/nagios/etc/nagiosql/services;
sudo mkdir /usr/local/nagios/etc/nagiosql/backup;
sudo mkdir /usr/local/nagios/etc/nagiosql/backup/hosts;
sudo mkdir /usr/local/nagios/etc/nagiosql/backup/services;
sudo chown nagios:nagcmd /usr/local/nagios/var/rw 
sudo chown nagios:nagcmd /usr/local/nagios/var/rw/nagios.cmd
sudo chown nagios:www-data /usr/local/nagios/etc/nagios.cfg;
sudo chown nagios:www-data /usr/local/nagios/etc/cgi.cfg;
sudo chown nagios:www-data /usr/local/nagios/etc/resource.cfg;
sudo chown nagios:www-data /usr/local/nagios/var/spool/checkresults;
sudo chown nagios:www-data /usr/local/nagios/bin/nagios;
sudo chmod 775 /usr/local/nagios/etc/
sudo chmod 777 /usr/local/nagios/bin/nagios
sudo chmod -R 777 /usr/local/nagios/share/nagiosql/config
sudo chmod -R 6775 /usr/local/nagios/etc/nagiosql;
sudo chmod 660 /usr/local/nagios/var/rw/nagios.cmd;
sudo chmod 775 /usr/local/nagios/etc/;
sudo chmod 664 /usr/local/nagios/etc/nagios.cfg;
sudo chmod 664 /usr/local/nagios/etc/cgi.cfg;
sudo chmod g+x /usr/local/nagios/var/rw/;
sudo chgrp www-data /usr/local/nagios/etc/;
sudo chgrp www-data /usr/local/nagios/etc/nagios.cfg;
sudo chgrp www-data /usr/local/nagios/etc/cgi.cfg;
sudo sed -i 's/^cfg/#cfg/' /usr/local/nagios/etc/nagios.cfg
echo "" | sudo tee -a /usr/local/nagios/etc/nagios.cfg
echo "cfg_dir=/usr/local/nagios/etc/nagiosql" | sudo tee -a /usr/local/nagios/etc/nagios.cfg


G. Configure NagiosQL in the browser

Next, configure the application in the browser by typing the command in the browser:

http://your_ip_server/nagios/nagiosql


If the browser asks to insert the username and password, insert your Nagios username and password. 

Insert username and password


After you insert the password, there will be a display like this:

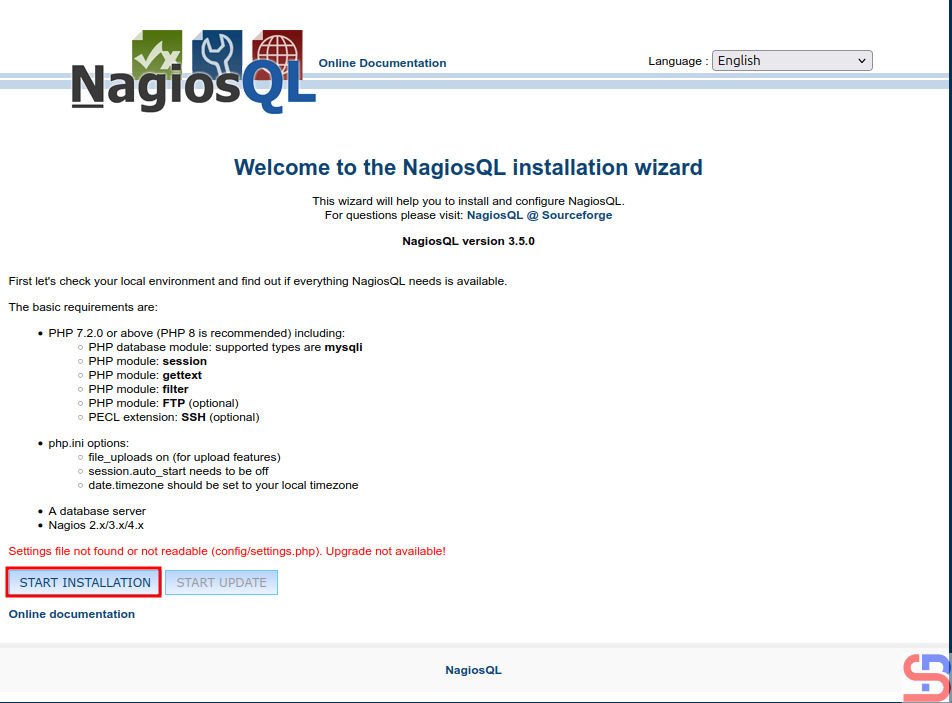
Configure the NagiosQL button


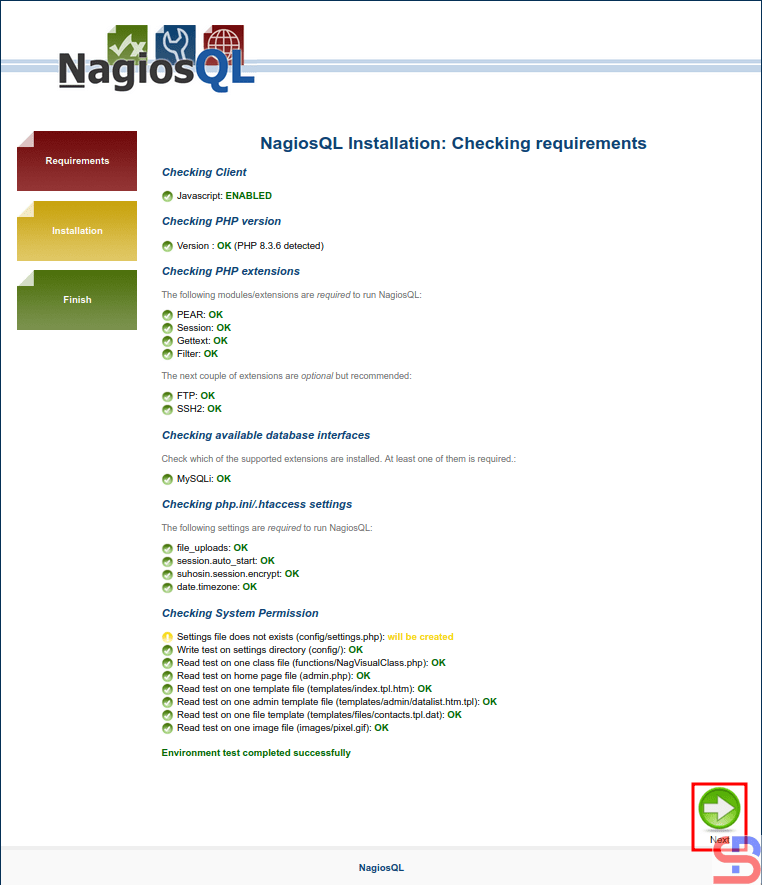
Click the START INSTALLATION button, and there is a display like the image below:

Checking requirements


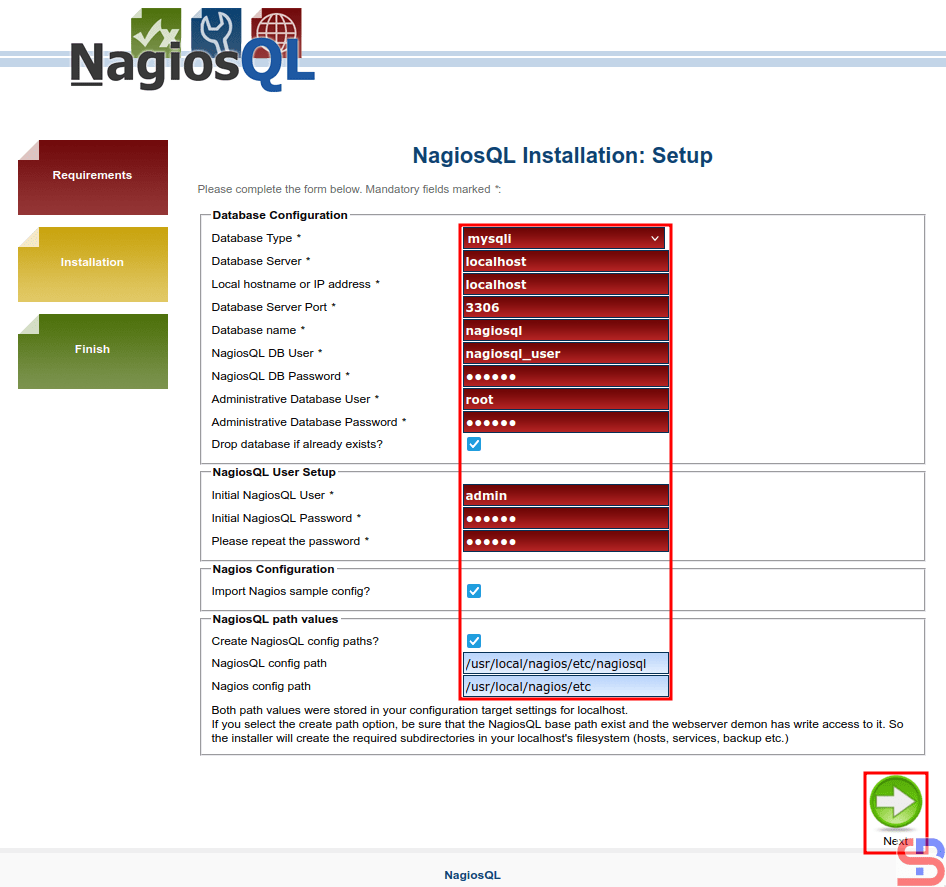
Make sure there is no error like in the image above. Click the Next button, and it will be an image like this:

Setup NagiosQL


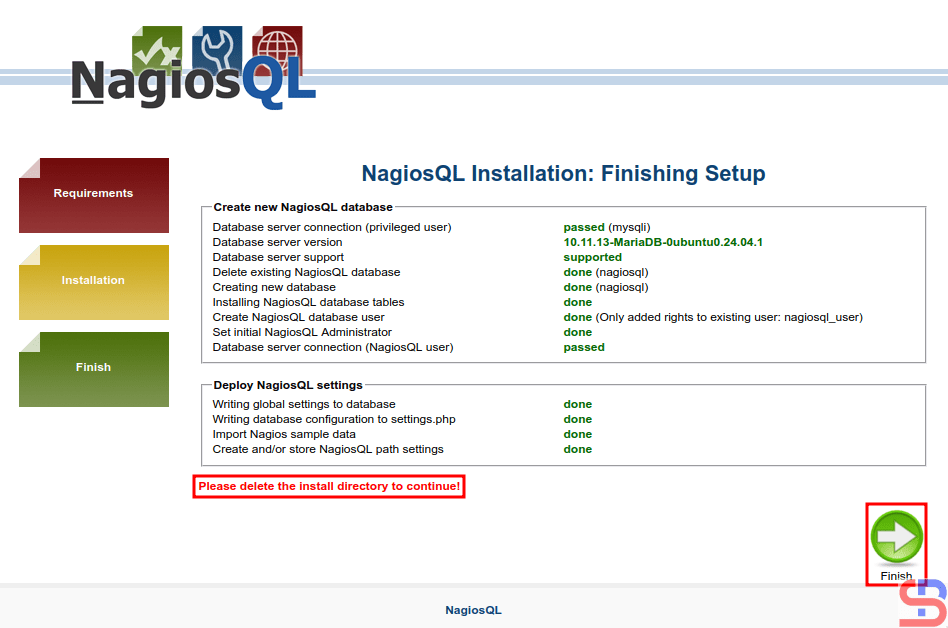
You must fill in the configuration columns, and I fill in like in this image above. After you fill it out, press the Next button, and there is a display like the image below:

The finishing setup


Before you click the Finish button, use the command below to delete the install directory:

rm -rf /usr/local/nagios/share/nagiosql/install/


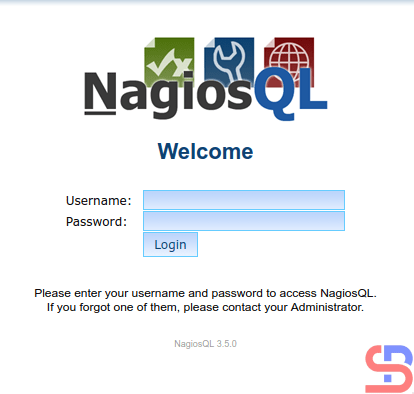
After that, click the Finish button, and it should display an image like the image below:

The NagiosQL login


Enter the username (admin) and password, and if nothing is wrong, the NagiosQL application will appear like the image below:

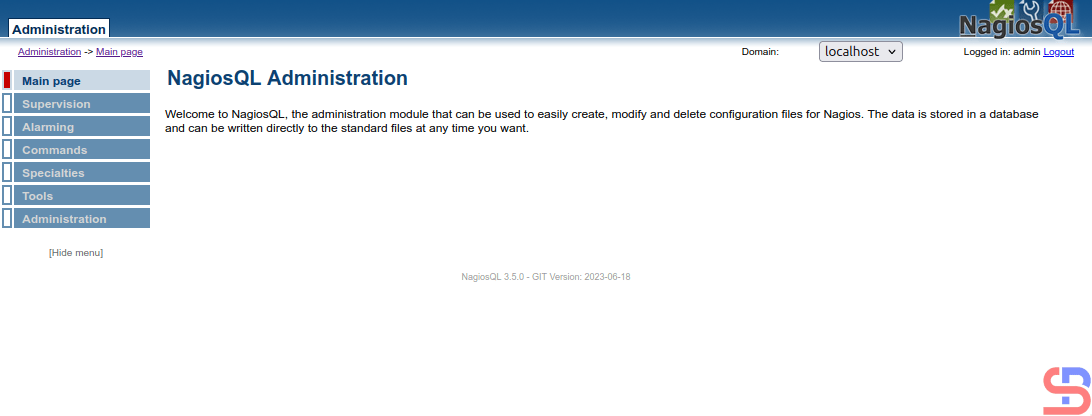
The page of NagioQL administration


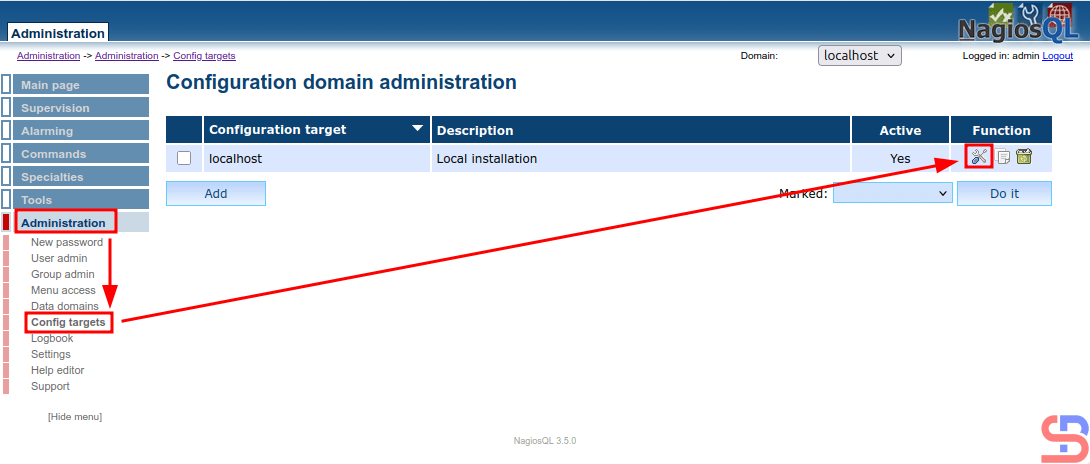
Now, configure the NagiosQL application to integrate it with Nagios. Click Administration > Config targets > Modify, like in the image below:

Configure domain administration


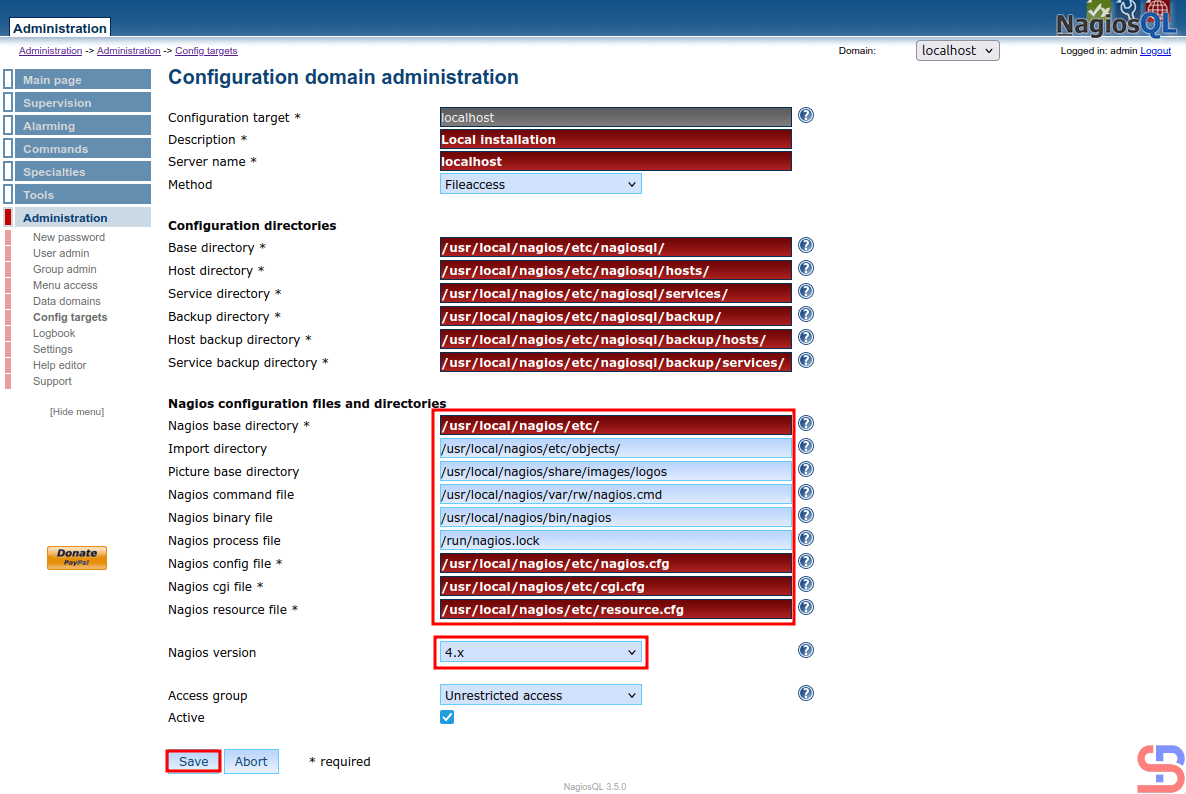
And there will be a display like the image below:

Configure the NagiosQL


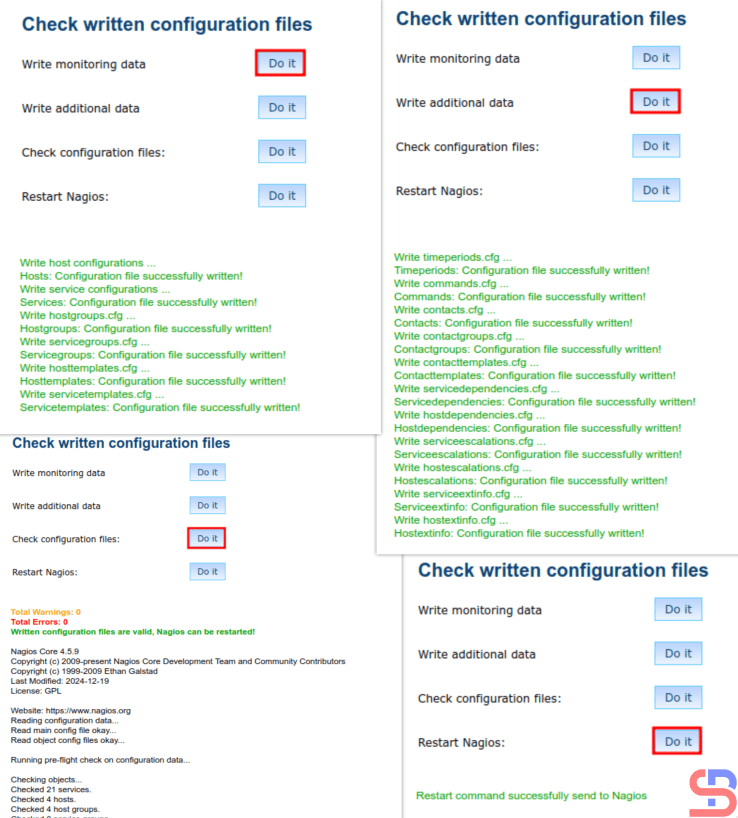
Configure in the red box like my configuration in the image above, and click the Save button. After that, go to Tools > Nagios control and click all the buttons like the image below, and make sure there is no error:

Click all the Do it buttons


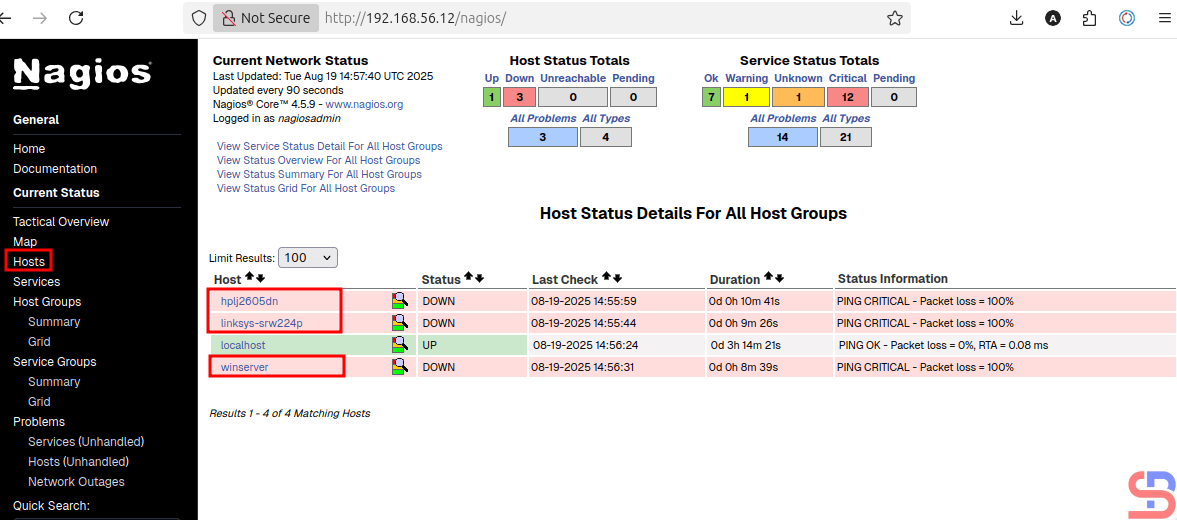
Now go to the Nagios application in the Hosts page and make sure that on the page, 3 default hosts appear in Nagios (hplj2605dn, linksys-srw224p, and winserver) besides localhost, like in the image below:

3 new hosts in the Hosts page on Nagios


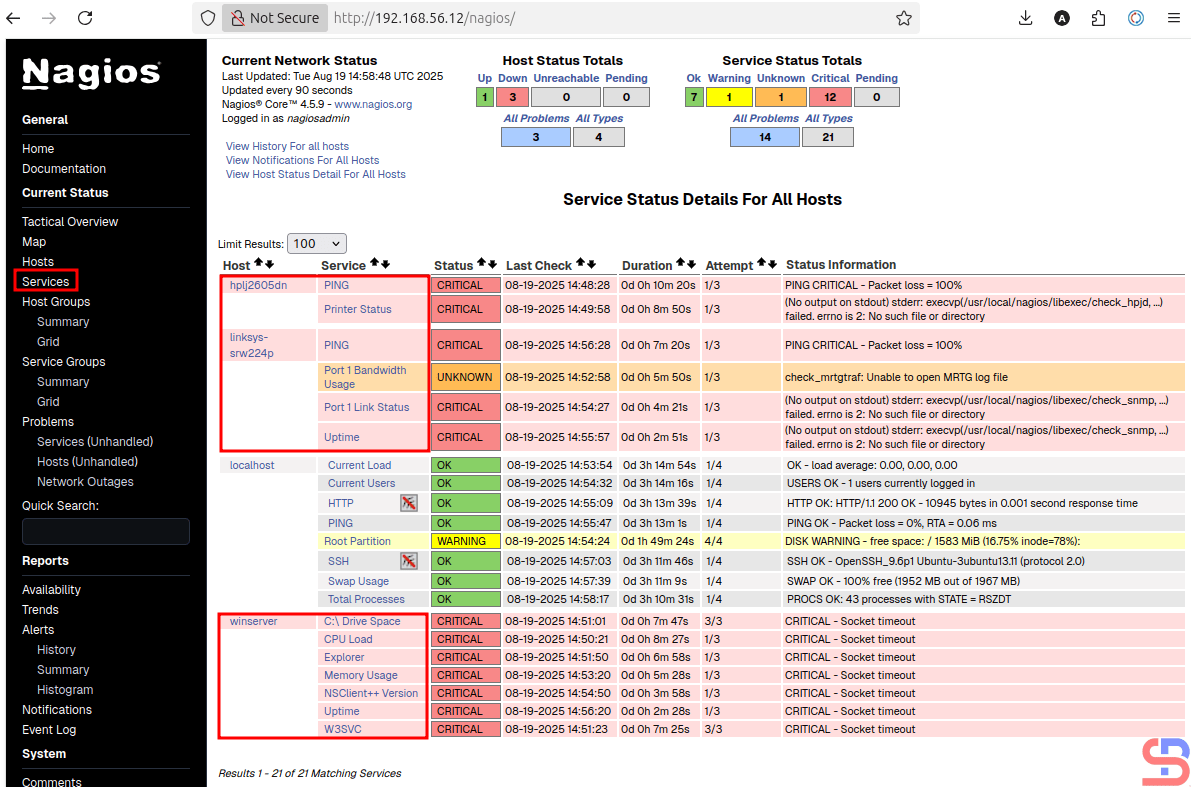
Now go to the Services section, and there should be services that appear on the 3 new default hosts:

Services in the 3 new hosts


If there are 3 additional hosts in the Hosts and Services section in Nagios, you have successfully integrated the Nagios application with the NagiosQL application.

Note

You have to be careful when filling in the Configuration domain administration section, because if it is wrong in this section, then the NagiosQL application will not run properly


References

sourceforge.net
tecadmin.net


How to Display Linux Applications Using the Most CPU and Memory With a Bash Script?

I have some Linux servers used to run some of the necessary applications in the office. But occasionally, I can’t reach certain servers due to issues, and I saw in the monitoring tool that the CPU or RAM on the server had increased significantly, resulting in the server having to be forcibly shut down and restarted. I tried to find out what applications caused the CPU or RAM to go up, but unfortunately, the monitoring application I used only showed the value of the CPU or RAM, but did not feature applications that used the CPU or RAM the most.


Problem

How to display Linux applications using the most CPU and memory with a bash script?


Solution

The ps command displays information about a selection of the active processes, so that by using the command, you can see which applications are using the most CPU and memory. Let’s say you want to display the 50 most CPU-intensive applications on Linux, then use the command below:

ps -eo pid,%cpu,args --sort=-%cpu | head -n 10


And use the command below to display the 10 applications that use the most memory on Linux:

ps -eo pid,%mem,args --sort=-%mem | head -n 10 


Based on the two commands above, you can create a bash script to see which applications are using the most CPU and RAM on Linux servers. Create a mon_cpu_ram.sh file and copy the bash script below into the file:

#!/bin/bash

# Get 50 application that take biggest cpu
ps -eo pid,%cpu,args --sort=-%cpu | head -n 50 > get_50_app_cpu.txt

# total cpu
awk 'NR > 1 {mem[$3" "$4" "$5" "$6" "$7" "$8" "$9" "$10" "$11" "$12" "$13" "$14" "$15" "$16" "$17] += $2} END {for (cmd in mem) printf "%.1f\t%s\n", mem[cmd], cmd}' get_50_app_cpu.txt | sort -nr | head -n 5 > total_cpu.txt

# Display date and uptime
date +"%Y-%m-%d %H:%M:%S" >> cpu_history.txt
uptime=`uptime -p`
echo "Uptime: $uptime" >> app_cpu_mem.txt

# get 3 apps that takeing biggest CPU
head -n3 total_cpu.txt >> cpu_history.txt
echo >> cpu_history.txt

# send the output of biggest CPU
date +"%Y-%m-%d %H:%M:%S" >> app_cpu_mem.txt
echo "Big CPU" >> app_cpu_mem.txt
head -n3 total_cpu.txt >> app_cpu_mem.txt


# Get 50 application that take biggest memory
ps -eo pid,%mem,args --sort=-%mem | head -n 50 > get_50_app_mem.txt

# total memory
awk 'NR > 1 {mem[$3" "$4" "$5" "$6" "$7" "$8" "$9" "$10" "$11" "$12" "$13" "$14" "$15" "$16" "$17] += $2} END {for (cmd in mem) printf "%.1f\t%s\n", mem[cmd], cmd}' get_50_app_mem.txt | sort -nr | head -n 5 > total_mem.txt

# get 3 apps that taking biggest memory
date +"%Y-%m-%d %H:%M:%S" >> mem_history.txt
head -n3 total_mem.txt >> mem_history.txt
echo >> mem_history.txt

# send the output of biggest Memory
echo "Big Memory" >> app_cpu_mem.txt
head -n3 total_mem.txt >> app_cpu_mem.txt

echo >> app_cpu_mem.txt


After that, permit the file and run it using the command below:

chmod +x mon_cpu_ram.sh
./mon_cpu_ram.sh


If you run the bash script, it will produce 3 files:

  • cpu_history.txt => Display the history of the CPU only
  • mem_history.txt => Display the histoy of the memory history
  • app_cpu_mem.txt => Displays the CPU and Memory history simultaneously

Run the bash script


If you want the file to run every 5 minutes, enter the file in the crontab by copying the script below into the crontab:

*/5 * * * *     cd /home/sysadmin/;. /mon_cpu_ram.sh


Note

I think this script is useful for sysadmins, especially me, to identify any applications that use the most CPU and RAM in Linux, so you can limit CPU or RAM to these applications.


References

man7.org
geeksforgeeks.org


How to Install Nagios on RockyLinux?

The previous article explained how to install the Nagios application on Ubuntu. This article will explain how to install the Nagios application on RockyLinux.


Problem

How to install Nagios on RockyLinux?


Solution

Below are the steps to install Nagios on RockyLinux and work on RockyLinux 9.5 and below. But I think these steps should apply to installing Nagios on RHEL and its derivatives, such as CentOS, AlmaLinux, and so on.

1. Download the packages

Install the packages needed to install Nagios using the command below:

 yum install -y httpd php php-devel gcc glibc glibc-common gd gd-devel make net-snmp-* wget zip unzip php-mysqlnd php-mysql*


2. Create a user and a group

Create a user and group for Nagios using the commands:

useradd nagios
groupadd nagcmd
usermod -G nagcmd nagios
usermod -G nagcmd apache


3. Download Nagios

Use the commands below to download Nagios, where at the time of this writing (February 2025), the latest version of Nagios is version 4.5.9:

cd /tmp
wget https://github.com/NagiosEnterprises/nagioscore/archive/refs/heads/master.zip -O nagios.zip
unzip nagios.zip 
cd nagioscore-master/


4. Install Nagios

By default, Linux will create a Nagios folder in the /usr/local folder to save Nagios configuration files. So, use the following commands to install Nagios:

./configure


Info
If you want to save all Nagios files in a non-default folder, for example, in the /data folder, then use the following command: ./configure –prefix=/data/nagios


After that, run the following commands:

make all
make install
make install-init
make install-commandmode
make install-config
make install-webconf


5. Create the password

Create a password for the user to access the Nagios application. Usually, nagiosadmin is a popular username for Nagios, but you can create another username.

htpasswd -c /usr/local/nagios/etc/htpasswd.users nagiosadmin

Create a password for the nagiosadmin user


Info
If you installed Nagios in a non-default folder, for example, in the /data folder, execute the below command: htpasswd -c /data/nagios/etc/htpasswd.users nagiosadmin


6. Download Nagios Plugins

Plugins are compiled executables or scripts (Perl, shell, Python, PHP, Ruby, etc.) that can be run from a command line to check the status of a host or service. Nagios Core uses the results from plugins to determine the current status of hosts and services on your network. As of this writing (February 2025), the latest version of Nagios plugins is version 2.4.12. You can check the latest version of Nagios plugins on this site. Run the following commands to download Nagios plugins:

cd /tmp
wget https://github.com/nagios-plugins/nagios-plugins/archive/refs/heads/master.zip -O nagios-plugins.zip
unzip nagios-plugins.zip 
cd nagios-plugins-master/


7. Install Nagios Plugins

After that, install Nagios plugins using the following commands:

./tools/setup
sudo ./configure --with-nagios-user=nagios --with-nagios-group=nagios
sudo make
sudo make install


8. Check the configuration

After installing Nagios and Nagios plugins, run the following command to check the configuration of Nagios:

/usr/local/nagios/bin/nagios -v /usr/local/nagios/etc/nagios.cfg


Info
If you installed Nagios in a non-default folder, for example, in the /data folder, execute the below command: /data/nagios/bin/nagios -v /data/nagios/etc/nagios.cfg


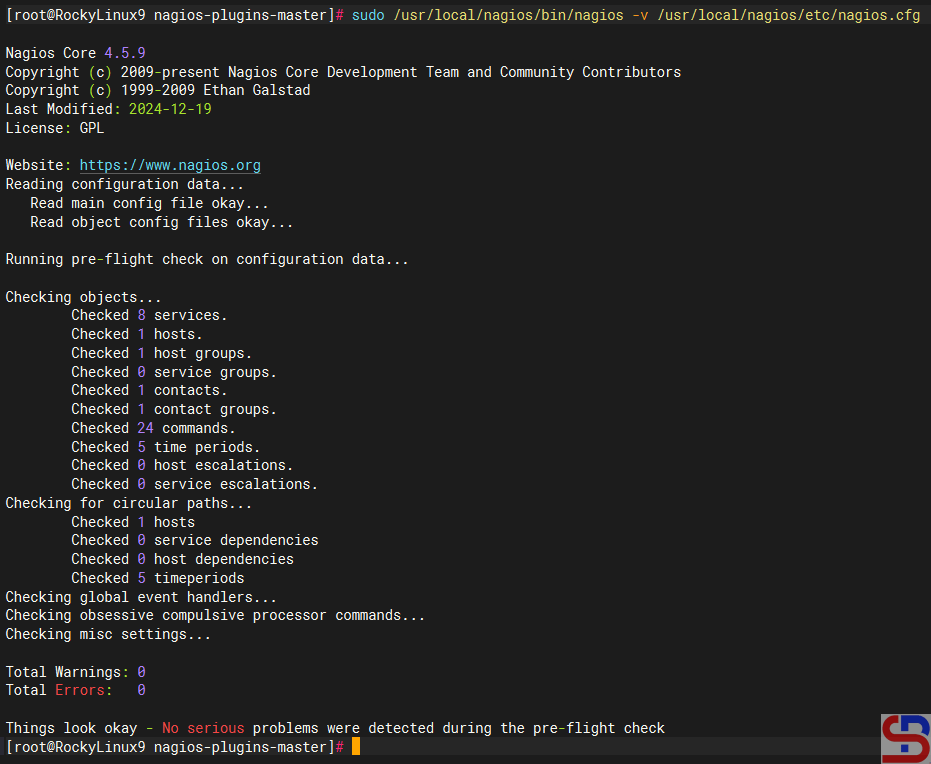
and make sure there is no error like in the image below:

Check the Nagios configuration


9. Turn on the services

Turn on the services using the commands below:

cp /lib/systemd/system/nagios.service /etc/systemd/system/
systemctl start httpd
systemctl start nagios
systemctl enable httpd
systemctl enable nagios


10. Check the application

Open your browser, and type in your browser:

http://your_ip_address_server/nagios


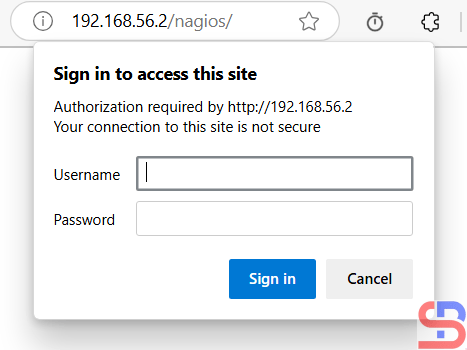
And there should be a display like the image below:

Open the Nagios application


If you don’t see the image like the above image in your browser, maybe the Firewall/IPTables is still on in your server. Run the following commands:

firewall-cmd --zone=public --add-port=80/tcp --permanent
firewall-cmd --reload
sed -i 's/SELINUX=.*/SELINUX=disabled/g' /etc/selinux/config
setenforce 0


Back to your browser again, and it should work now. Insert the username (nagiosadmin) and the password for Nagios. If the username and the password are right, the Nagios application will appear like this:

Open the Nagios application


If you want to know which hosts are being monitored by Nagios, click Hosts. Nagios will display the hosts that are being monitored:

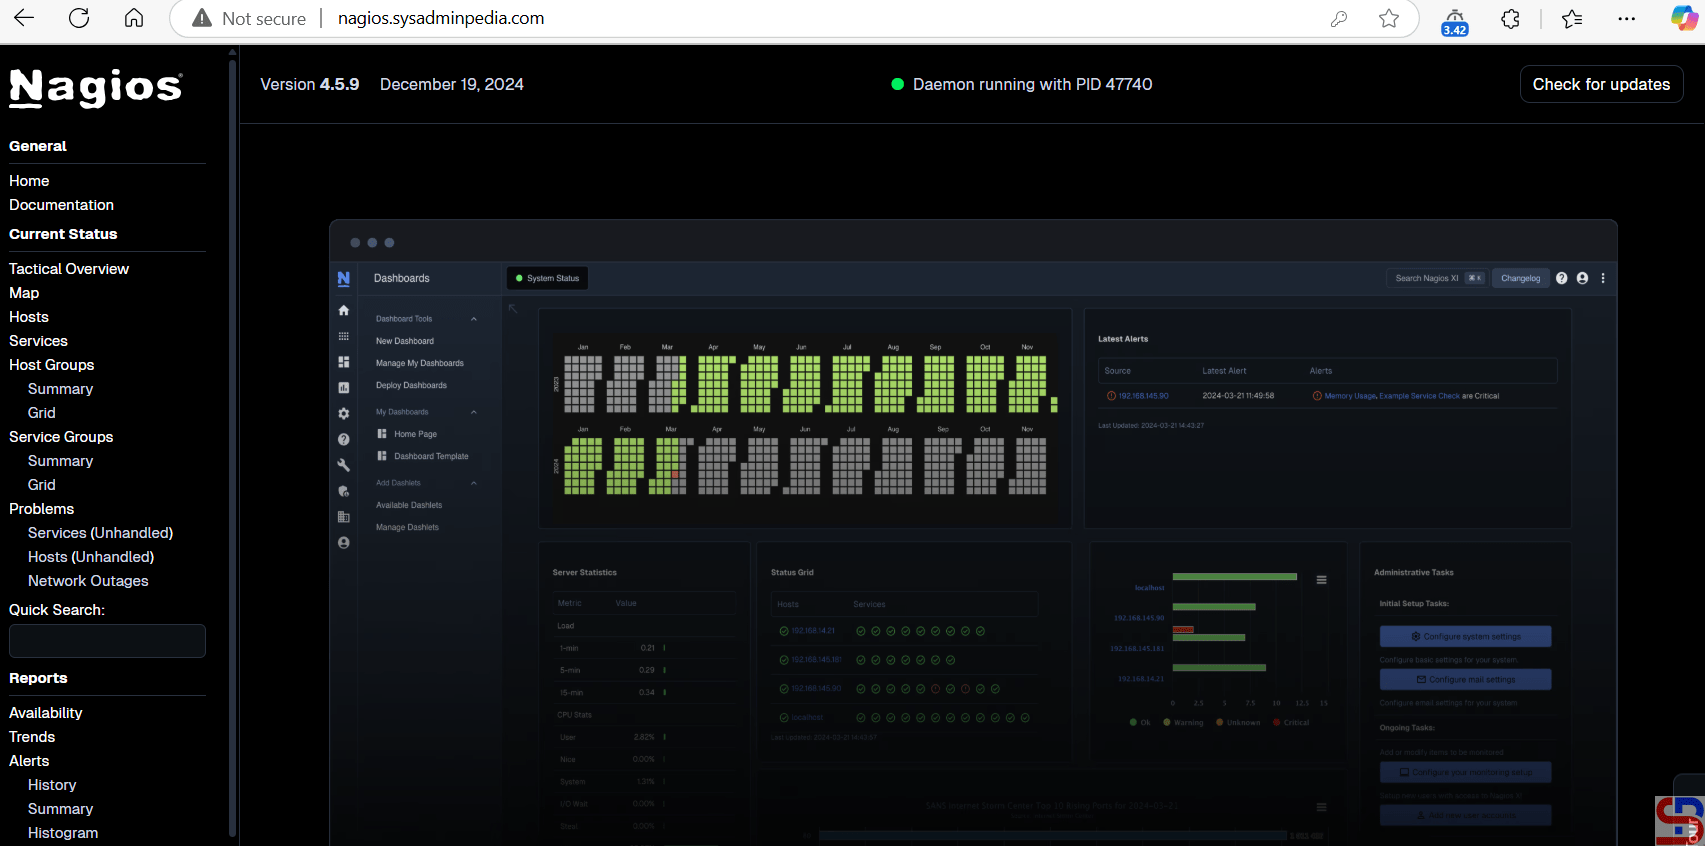
Hosts monitored by Nagios


From the picture above, it can be seen that currently, Nagios is only monitoring the Nagios server or localhost. If you want to know which services are being monitored by Nagios, click Services. Nagios will display the services that are being monitored:

Services monitored by Nagios


From the picture above, you can see that Nagios monitored 8 services for the Nagios server or localhost.


Note

If you have a domain/subdomain and want to use that domain/subdomain for the Nagios application, create a virtual host on your web server. For example, I have the domain sysadminpedia.com and want to use the subdomain nagios.sysadminpedia.com for the Nagios application. So, I created the script below in the file /etc/httpd/conf.d/nagios.sysadminpedia.com.conf:

<VirtualHost *:80>
    ServerName nagios.sysadminpedia.com
    ServerAdmin sysadmin@nagios.sysadminpedia.com
    DocumentRoot /usr/local/nagios/share
    <Directory /usr/local/nagios/share>
         Options -Indexes +FollowSymLinks
         AllowOverride All
    </Directory>

    ErrorLog /var/log/httpd/nagios.sysadminpedia.com-error.log
    CustomLog /var/log/httpd/nagios.sysadminpedia.com-access.log combined
</VirtualHost>


Restart the web server, open your browser, and type your domain/subdomain for Nagios, and it should be like the image below:

Using a domain or a subdomain for the Nagios application


Info
If you installed Nagios in a non-default folder, for example, in the /data folder, you can copy the script above, but you must change the word /usr/local to /data.


References

support.nagios.com
tecmint.com
statusengine.org


How to Install Nagios on Ubuntu?

Nagios is an event monitoring system created by Ethan Galstad and first released in 2002, which offers monitoring and alerting services for servers, switches, applications, and services. It alerts users when things go wrong and alerts them again when the problem has been resolved. There are 2 types of Nagios: Nagios XI for the enterprise version and Nagios Core for the free version. This article will explain how to install Nagios Core on Ubuntu.


Problem

How to install Nagios on Ubuntu?


Solution

Here are the steps to install Nagios on Ubuntu, and these steps work on Ubuntu 24.04 and below and I think it should also work on Debian.

1. Download the packages

Install the packages needed to install Nagios using the command below:

sudo apt-get install autoconf gcc libc6 make wget unzip apache2 php libapache2-mod-php libgd-dev libssl-dev


2. Create a user and a group

After that, create a user and group for Nagios using the commands:

sudo useradd nagios
sudo groupadd nagcmd
sudo usermod -a -G nagcmd nagios
sudo usermod -a -G nagcmd www-data


3. Download Nagios

Use the commands below to download Nagios, where at the time of this writing (February 2025), the latest version of Nagios is version 4.5.9:

cd /tmp
wget https://github.com/NagiosEnterprises/nagioscore/archive/refs/heads/master.zip -O nagios.zip
unzip nagios.zip
cd nagioscore-master/


4. Install Nagios

By default, Linux will create a Nagios folder in the /usr/local folder to save Nagios configuration files. So, use the following commands to install Nagios:

sudo ./configure --with-command-group=nagcmd --with-httpd-conf=/etc/apache2/sites-enabled


Info
If you want to save all Nagios files in a non-default folder, for example, in the /data folder, then use the following command: sudo ./configure –prefix=/data/nagios –with-command-group=nagcmd –with-httpd-conf=/etc/apache2/sites-enabled

After that, run the following commands:

sudo make all
sudo make install
sudo make install-init
sudo make install-daemoninit
sudo make install-config
sudo make install-commandmode
sudo make install-webconf
sudo a2enmod rewrite
sudo a2enmod cgi


5. Create the password

Create a password for the user Nagios to access the Nagios application. Nagiosadmin is usually a popular username for Nagios, but you can create another.

sudo htpasswd -c /usr/local/nagios/etc/htpasswd.users nagiosadmin

Create the password


Info
If you installed Nagios in a non-default folder, for example, in the /data folder, execute the below command: sudo htpasswd -c /data/nagios/etc/htpasswd.users nagiosadmin


6. Download Nagios Plugins

Plugins are compiled executables or scripts (Perl, shell, Python, PHP, Ruby, etc.) that can be run from a command line to check the status of a host or service. Nagios Core uses the results from plugins to determine the current status of hosts and services on your network. As of this writing (February 2025), the latest version of Nagios plugins is version 2.4.12. You can check the latest version of Nagios plugins on this site. Run the following commands to download Nagios plugins:

cd /tmp
wget https://github.com/nagios-plugins/nagios-plugins/archive/refs/heads/master.zip -O nagios-plugins.zip
unzip nagios-plugins.zip 
cd nagios-plugins-master/


7. Install Nagios Plugins

After that, install Nagios plugins using the following commands:

./tools/setup
sudo ./configure --with-nagios-user=nagios --with-nagios-group=nagios
sudo make
sudo make install


8. Check the configuration

After installing Nagios and Nagios plugins, run the following command to check the configuration of Nagios:

sudo /usr/local/nagios/bin/nagios -v /usr/local/nagios/etc/nagios.cfg


Info
If you installed Nagios in a non-default folder, for example, in the /data folder, execute the below command: sudo /data/nagios/bin/nagios -v /data/nagios/etc/nagios.cfg

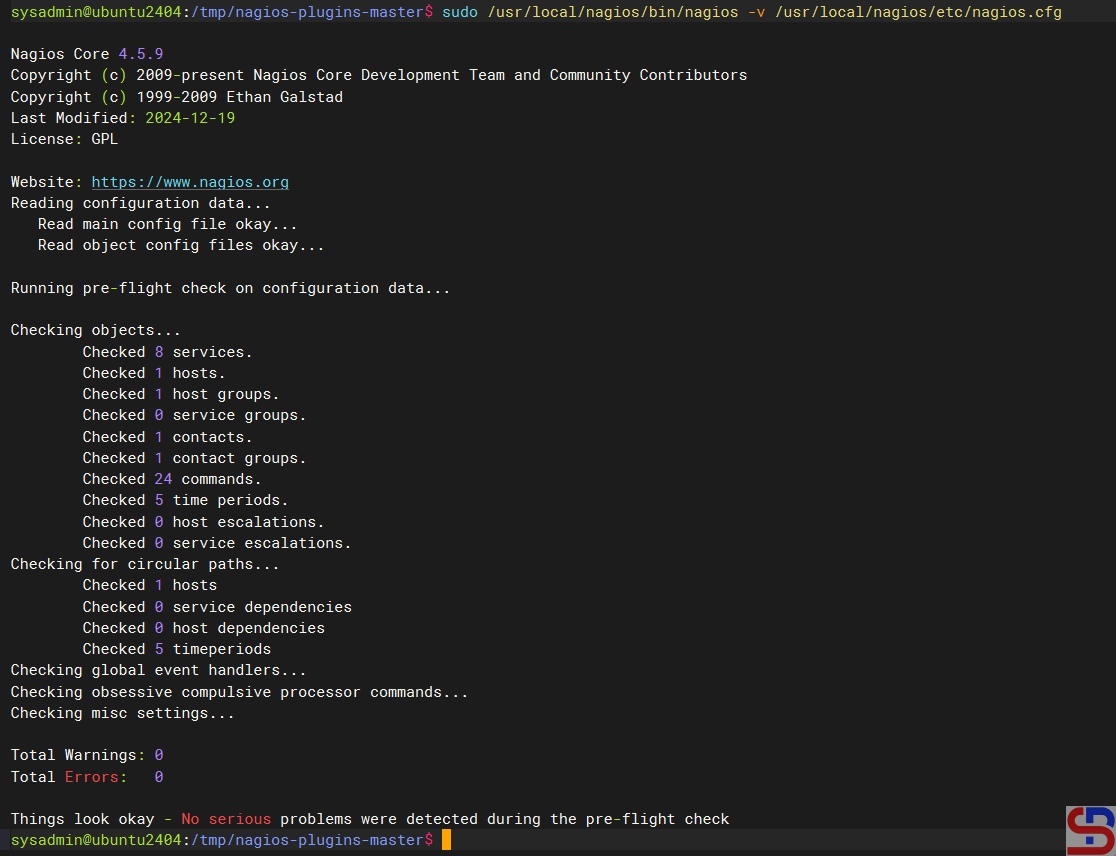
and make sure there is no error like in the image below:

Check the Nagios configuration


9. Turn on the services

Turn on the services using the commands below:

sudo systemctl start nagios.service
sudo systemctl enable nagios
sudo systemctl restart apache2.service


10. Check the application

Open your browser, and type in your browser:

http://your_ip_address_server/nagios


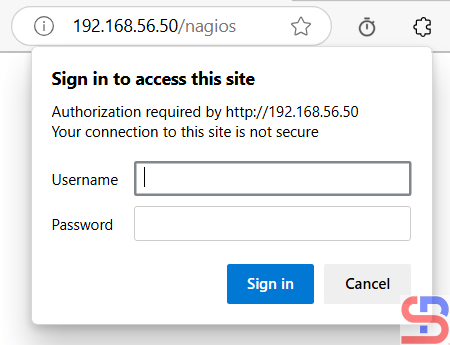
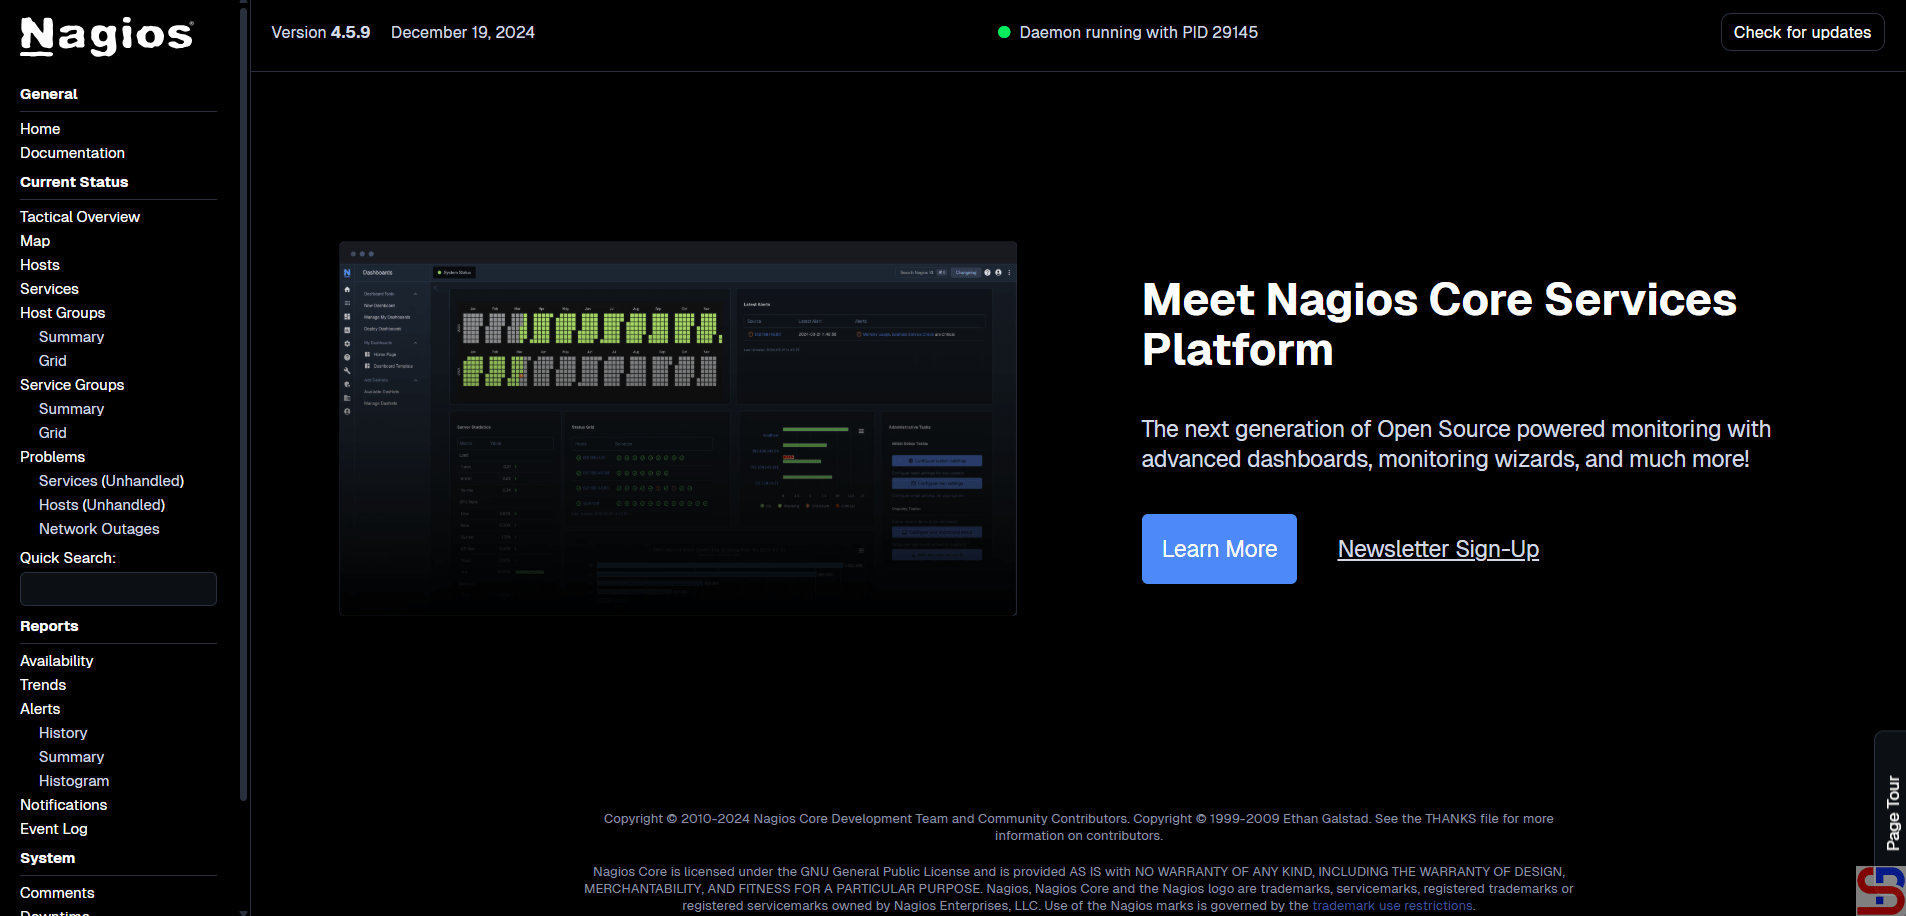
And there should be a display like the image below:

Open Nagios in the browser


If you don’t see the image like the above image in your browser, maybe the Firewall/IPTables is still on your server. Run the following commands:
sudo ufw allow Apache
sudo ufw reload


Back to your browser again, and it should work now. Insert the username (nagiosadmin) and the password for Nagios. If the username and the password are right, the Nagios application will appear like this:

install nagios on ubuntu
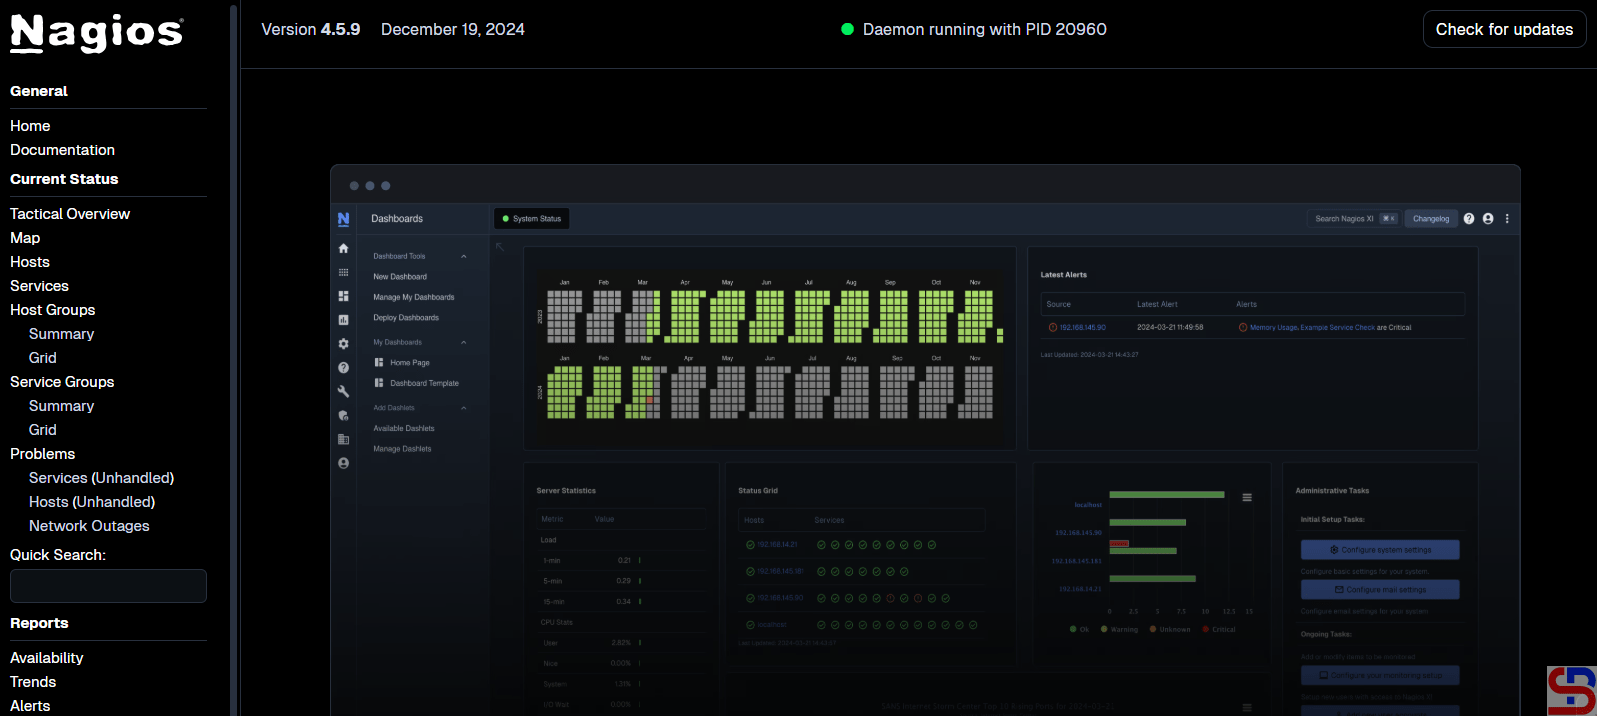
Nagios application


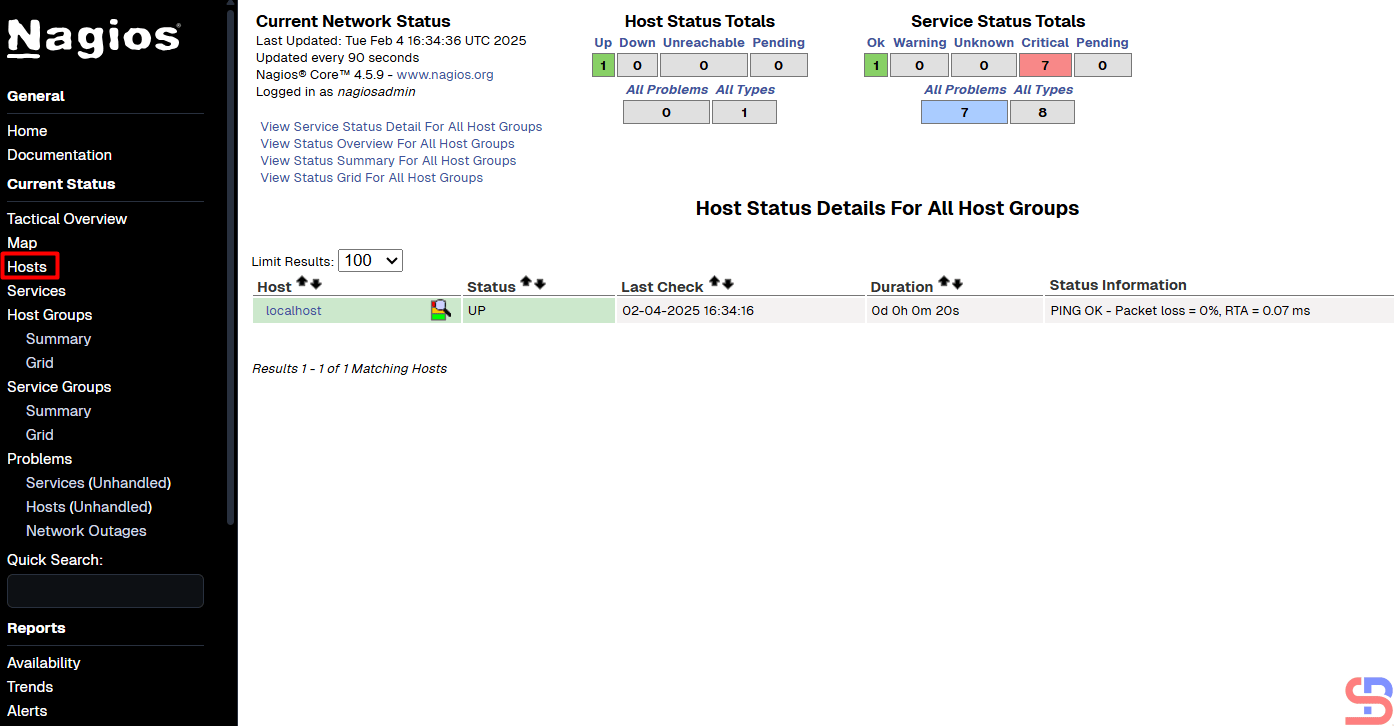
If you want to know which hosts are being monitored by Nagios, click Hosts, and Nagios will display the hosts that are being monitored:

install nagios on ubuntu
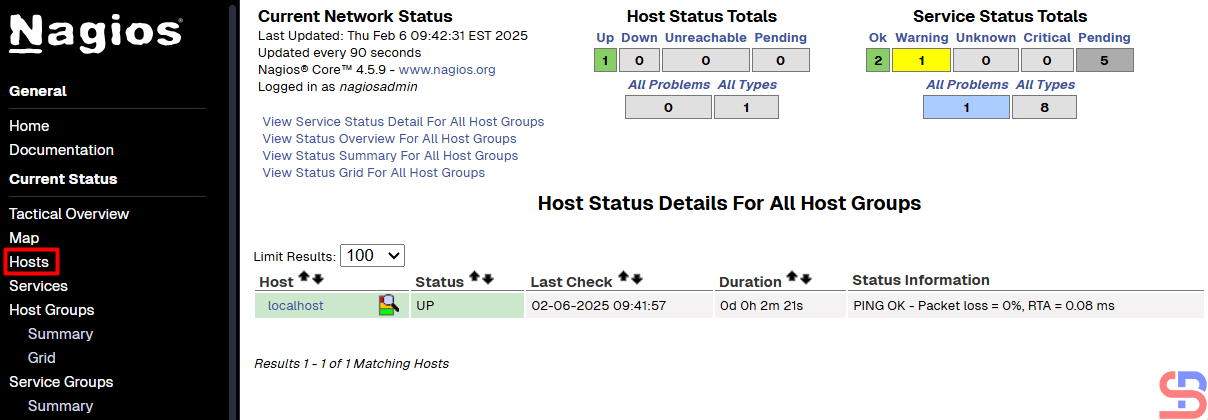
Hosts monitored by Nagios


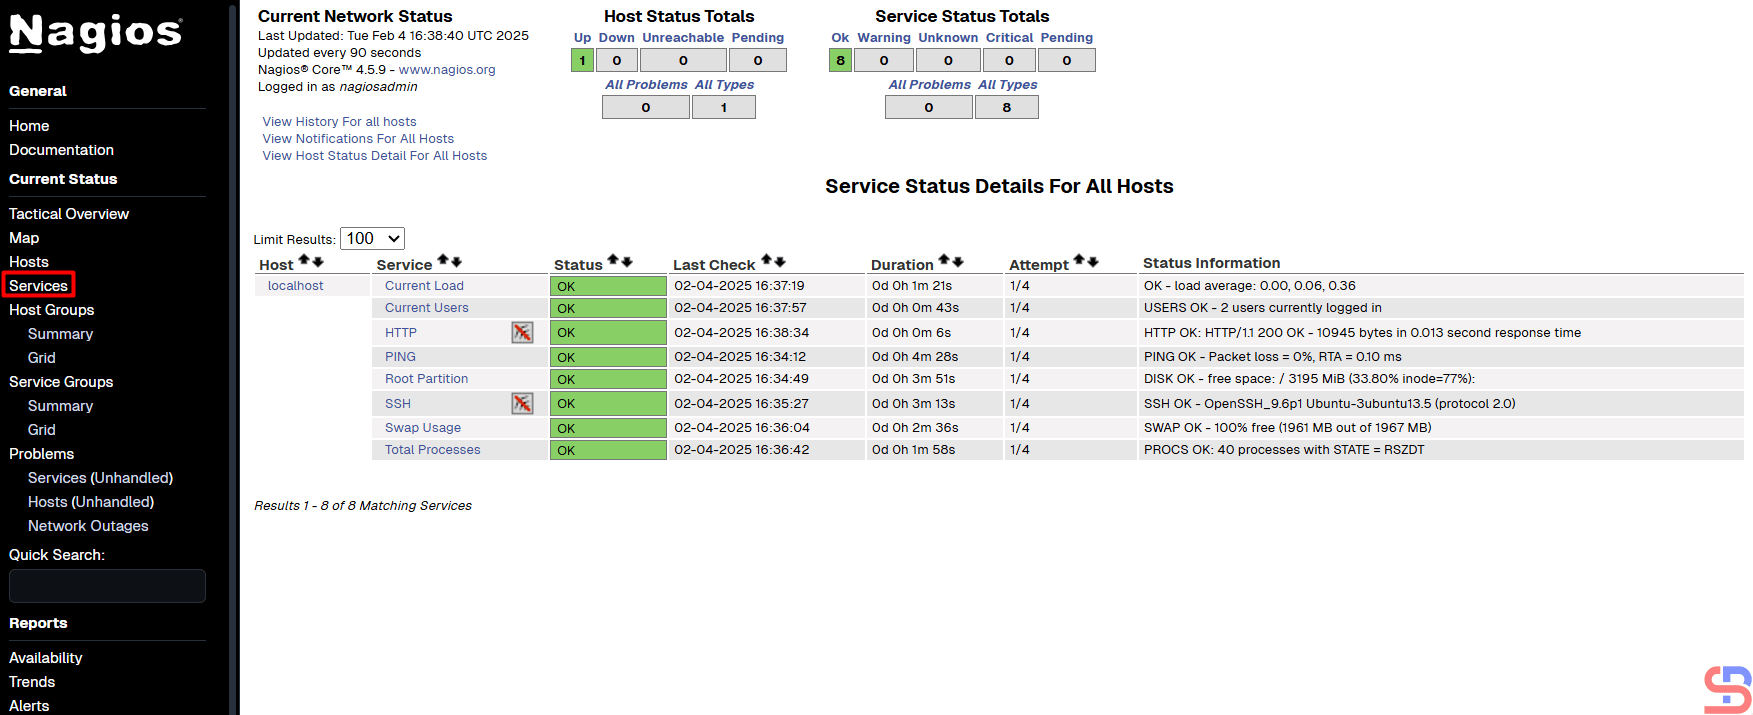
You can see from the picture above, Nagios only monitors the Nagios server or localhost. If you want to know which services are being monitored by Nagios, click Services then Nagios will display the services that are being monitored:

install nagios on ubuntu
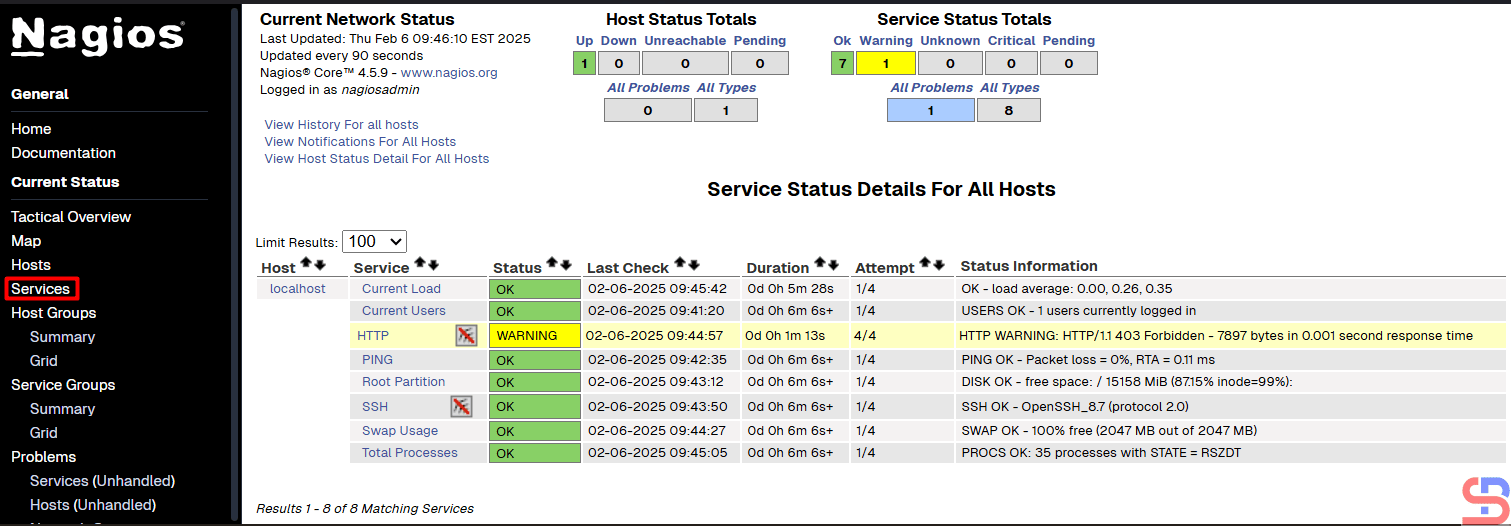
Services monitored by Nagios


From the picture above, Nagios monitors 8 services for the Nagios server or localhost.


Note

If you have a domain/subdomain and want to use that domain/subdomain for the Nagios application, create a virtual host on your web server. For example, I have the domain sysadminpedia.com and want to use the subdomain nagios.sysadminpedia.com for the Nagios application. So, I created the script below in the file /etc/apache2/sites-enabled/nagios.sysadminpedia.com.conf:

<VirtualHost *:80>
    ServerName nagios.sysadminpedia.com
    ServerAdmin sysadmin@nagios.sysadminpedia.com
    DocumentRoot /usr/local/nagios/share
    <Directory /usr/local/nagios/share>
         Options -Indexes +FollowSymLinks
         AllowOverride All
    </Directory>

    ErrorLog /var/log/apache2/nagios.sysadminpedia.com-error.log
    CustomLog /var/log/apache2/nagios.sysadminpedia.com-access.log combined
</VirtualHost>


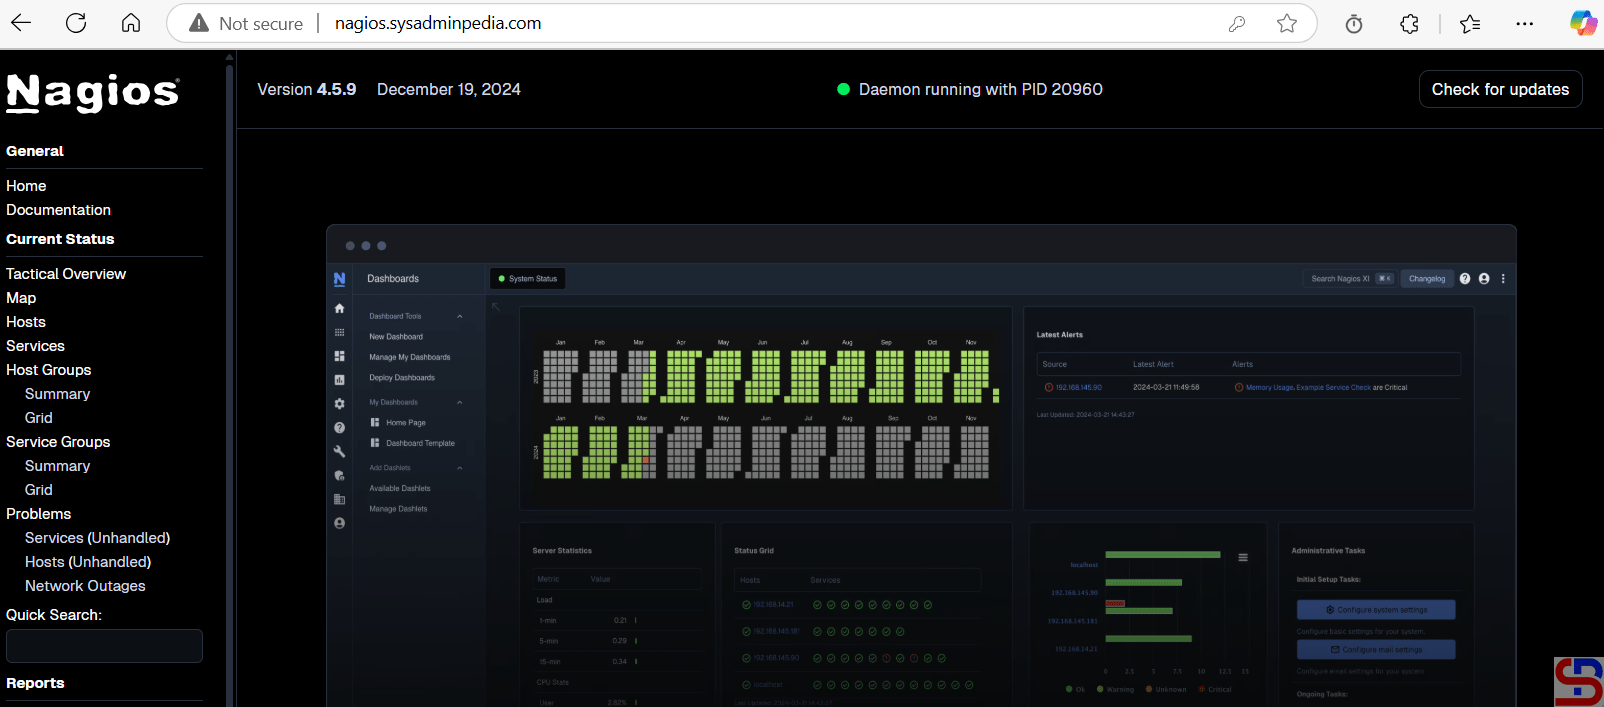
Restart the webserver, open your browser, and type your domain/subdomain for Nagios, and it should be like the image below:

install nagios on ubuntu
Using a domain/subdomain for the Nagios application


Info
If you installed Nagios in a non-default folder, for example, in the /data folder, you can copy the script above, but you must change the word /usr/local to /data


References

en.wikipedia.org
assets.nagios.com
techoverflow.net