How to Automatically Copy a File During Linux User Creation?
written by sysadmin | 28 February 2025
If you have been a sysadmin in a company for a long time, then you will usually change the Linux server settings according to what you want, for example, you create a recycle bin in your Linux server. If there is a new sysadmin, it will take a long time to explain what you are changing. Therefore, you plan to create a readme.txt file on the Linux server that contains the changes you made on the Linux server and automatically copy a file during Linux user creation.
Problem
How to automatically copy a file during Linux user creation?
Solution
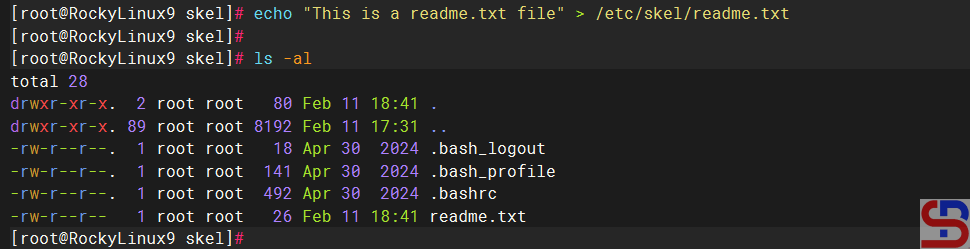
Go to the /etc/skel folder, which contains files and directories. If a new Linux user is created, all the files and directories in this folder will be copied to the Linux user’s folder. Below is an image of the contents of the skel folder in the RockyLinux distro, and the contents of the skel folder can be different in each Linux distro:
The skel folder in the RockyLinux distro
If you want to copy a file to each new Linux user, create the file in the /etc/skel folder. For example, you create a readme.txt file like the following command:
echo 'This is a readme.txt file' > /etc/skel/readme.txt
Create a readme.txt file
After that, create a new Linux user, for example, bob. Use the command below to create a user named bob on Linux:
useradd -m bob
The -m option tells useradd to create the user’s home directory. Then, check the bob folder if the readme.txt file is in the bob folder by using the command below:
ls -l /home/bob
cat /home/bob/readme.txt
Check in the user folder
From the image above, you can see that the readme.txt file is already in the bob folder automatically. To be more sure, try creating a new Linux user, and the readme.txt file should appear in your new user.
Note
Make sure to use the -m option when creating a new user in Linux so that the file(s) or folder(s) can be automatically copied from the skel folder.
By default, as of this writing (February 2025), there is no recycle bin function like in Windows in the Linux CLI. This is very dangerous if you accidentally delete an important file or folder on your Linux CLI; the file or folder will disappear forever. Therefore, you have to create a recycle bin on the Linux CLI.
Problem
How to create a Recycle Bin on Linux CLI?
Solution
You must first determine where the recycle bin is located, and this article uses the .trash folder as a recycle bin on the Linux server. Then type the command below to carry out the folder function as a recycle bin (you can change the .trash folder to the name of the folder you want):
You have to change the .bashrc file in each of your Linux users, so that if there are 3 users on your Linux server, then you must change the three .bashrc files so that you can run the Recycle Bin function in each user.
For example, you want to delete the Linux.gif file from the folder /home/sysadmin, so I use the command below to delete it:
rm /home/sysadmin/Linux.gif
Info
If you want to delete the folder, use the rm command only, not use rm -rf command..
After that, check the .trash folder and you will see that the file you deleted is still in the folder.
Delete the file after creating a recycle bin in Linux
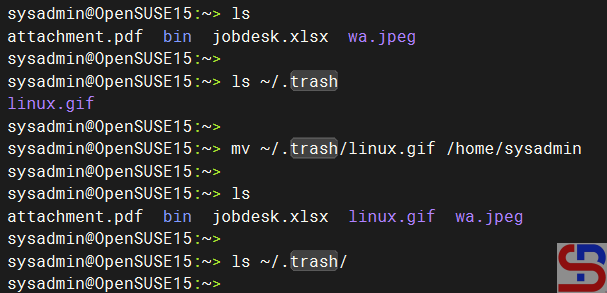
So, now the Recycle Bin function in the Linux server runs normally. If you want to return the file to the previous folder, then type the command below:
mv ~/.trash/linux.gif /home/sysadmin
Move the file from the .trash folder
But if you want to delete the file, you must enter the .trash folder, then type the commands below:
cd ~/.trash
alias rm='rm -i'
rm -rf Linux.gif
source ~/.bashrc
Delete the file in the .trash command
If you want to delete all files or folders in the .trash folder, then type the command below:
cd ~/.trash
alias rm='rm -i'
rm -rf *
source ~/.bashrc
Remember that you must always run the source ~/.bashrc command. After you delete the .trash folder, the file or folder you delete will be in the .trash folder. If not, the file or folder will disappear forever from your Linux server.
Note
You must know that if you use sudo to delete a file or folder, the file or folder will disappear forever and will not be stored in the .trash folder as shown below:
Delete a file using sudo
So, be careful when you delete file(s) or folder(s) using sudo.
When you install Linux on a server for the first time, you are asked to select the regional zone where the server is located so that Linux will create the date and the time on the server based on that zone. But sometimes you want to change the timezone on your Linux server.
Problem
How to change the timezone on the Linux server?
Solution
To see the timezone currently used on the server, you can use the command:
timedatectl
The timedatectl command
From the image above, the server’s time zone is in the American region in the New York area. To see the timezone provided by Linux, use the following command:
timedatectl list-timezones
List of timezones
If you want to change the timezone to Singapore, then you can type the command below:
timedatectl set-timezone Asia/Singapore
Then the time on the server will change to Singapore time, as in the image below:
After updating the timezone
Note
Apart from using the timedatectl command, you can also use the command below:
tzselect
There is a list of the continents. Select the number that corresponds to the zone you want. For example, I choose Singapore as the timezone on my server, then I will choose number 5 for Asia, and will choose Singapore in the country selection, as in the image below:
Alternative to change the timezones
Once finished, the script in the red box must be inserted into the .profile or .bashrc file (if there is no .bashrc file on the server, then create the file manually). After that, use the command:
How to Remove And Limit Journal Log Size in Linux?
written by sysadmin | 28 February 2025
systemd-journald is a service that collects and stores logging data, creating structured, indexed journals based on the logging information it receives. But sometimes the logs produced are so large that you have to remove and limit the journal log.
Problem
How to remove and limit journal log size in Linux?
Solution
By default, the log journal is in the folder/var/log/journal and will retain 4 GB of data. You can limit the log size by using the format below:
journalctl --vacuum-size=BYTES
If you want to remove the journal log to 100 MB, you can use the command below:
journalctl --vacuum-size=100M
The journal log size will reduce to around 100 MB, like in the image below, after you execute the above command:
Remove the journal log
You can also make the journal log remain 100 MB without running the command above by configuring it in the journald.conf file. But the file is in a different folder in each Linux distro, so you have to search for the file using the following command:
find / -name journald.conf
After you find the file, for example, you want to limit the journal log to only 100 MB, then change the file so that it looks like the following:
[Journal]
SystemMaxUse=100MB
After that, restart the journald service using the command below:
systemctl restart systemd-journald.service
The journal log size should be produced in the folder /var /log, only measuring about 100 MB.
Note
If you want to test to generate lots of logging quickly, you can use the following command:
while true; do dd if=/dev/urandom bs=3 count=10000 | base64 | logger; done
At the same time, you can execute the following command to display the size of the journal log in another terminal:
while true; do du -s /var/log/journal/ ; sleep 5 ;done
What you should know is that the journal should not be disabled, especially if you use rsyslogd, because rsyslogd can get its information from journald, and they play very well together this way.
The previous article explained how to install the Nagios application on Ubuntu. This article will explain how to install the Nagios application on RockyLinux.
Problem
How to install Nagios on RockyLinux?
Solution
Below are the steps to install Nagios on RockyLinux and work on RockyLinux 9.5 and below. But I think these steps should apply to installing Nagios on RHEL and its derivatives, such as CentOS, AlmaLinux, and so on.
1. Download the packages
Install the packages needed to install Nagios using the command below:
yum install -y httpd php php-devel gcc glibc glibc-common gd gd-devel make net-snmp-* wget zip unzip php-mysqlnd php-mysql*
2. Create a user and a group
Create a user and group for Nagios using the commands:
Use the commands below to download Nagios, where at the time of this writing (February 2025), the latest version of Nagios is version 4.5.9:
cd /tmp
wget https://github.com/NagiosEnterprises/nagioscore/archive/refs/heads/master.zip -O nagios.zip
unzip nagios.zip
cd nagioscore-master/
4. Install Nagios
By default, Linux will create a Nagios folder in the /usr/local folder to save Nagios configuration files. So, use the following commands to install Nagios:
./configure
Info
If you want to save all Nagios files in a non-default folder, for example, in the /data folder, then use the following command: ./configure –prefix=/data/nagios
After that, run the following commands:
make all
make install
make install-init
make install-commandmode
make install-config
make install-webconf
5. Create the password
Create a password for the user to access the Nagios application. Usually, nagiosadmin is a popular username for Nagios, but you can create another username.
If you installed Nagios in a non-default folder, for example, in the /data folder, execute the below command: htpasswd -c /data/nagios/etc/htpasswd.users nagiosadmin
6. Download Nagios Plugins
Plugins are compiled executables or scripts (Perl, shell, Python, PHP, Ruby, etc.) that can be run from a command line to check the status of a host or service. Nagios Core uses the results from plugins to determine the current status of hosts and services on your network. As of this writing (February 2025), the latest version of Nagios plugins is version 2.4.12. You can check the latest version of Nagios plugins on this site. Run the following commands to download Nagios plugins:
cd /tmp
wget https://github.com/nagios-plugins/nagios-plugins/archive/refs/heads/master.zip -O nagios-plugins.zip
unzip nagios-plugins.zip
cd nagios-plugins-master/
7. Install Nagios Plugins
After that, install Nagios plugins using the following commands:
./tools/setup
sudo ./configure --with-nagios-user=nagios --with-nagios-group=nagios
sudo make
sudo make install
8. Check the configuration
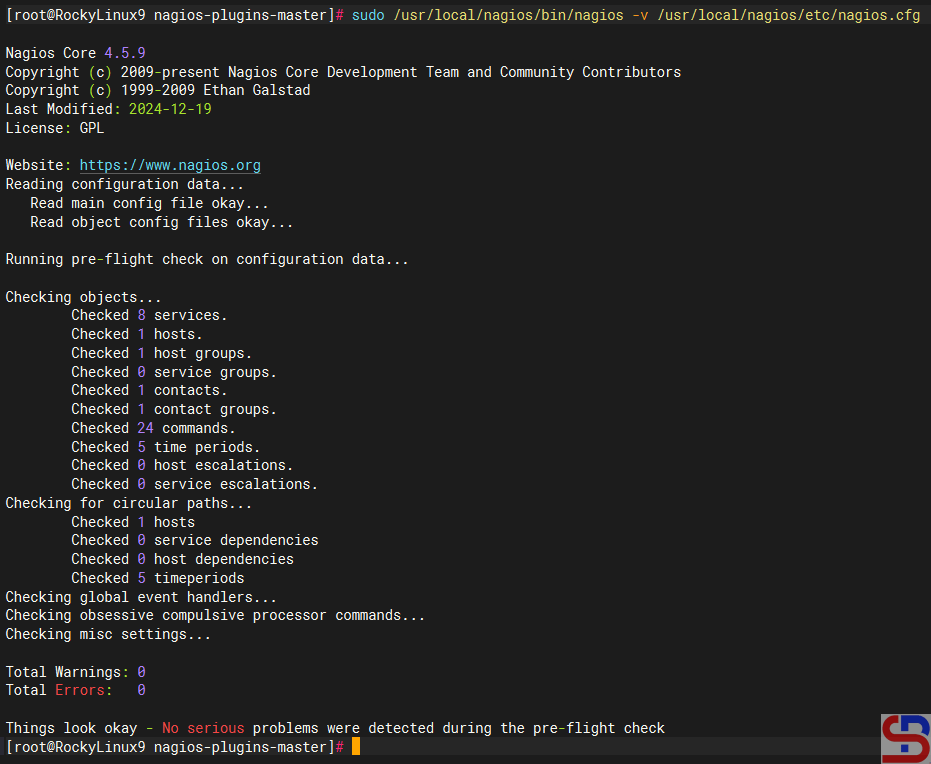
After installing Nagios and Nagios plugins, run the following command to check the configuration of Nagios:
If you installed Nagios in a non-default folder, for example, in the /data folder, execute the below command: /data/nagios/bin/nagios -v /data/nagios/etc/nagios.cfg
and make sure there is no error like in the image below:
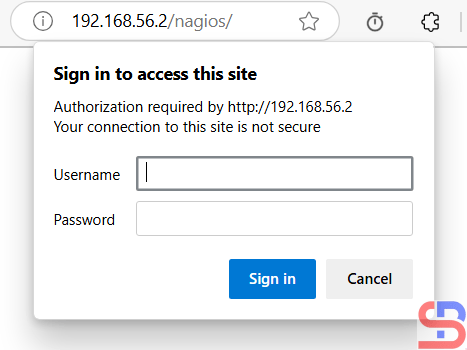
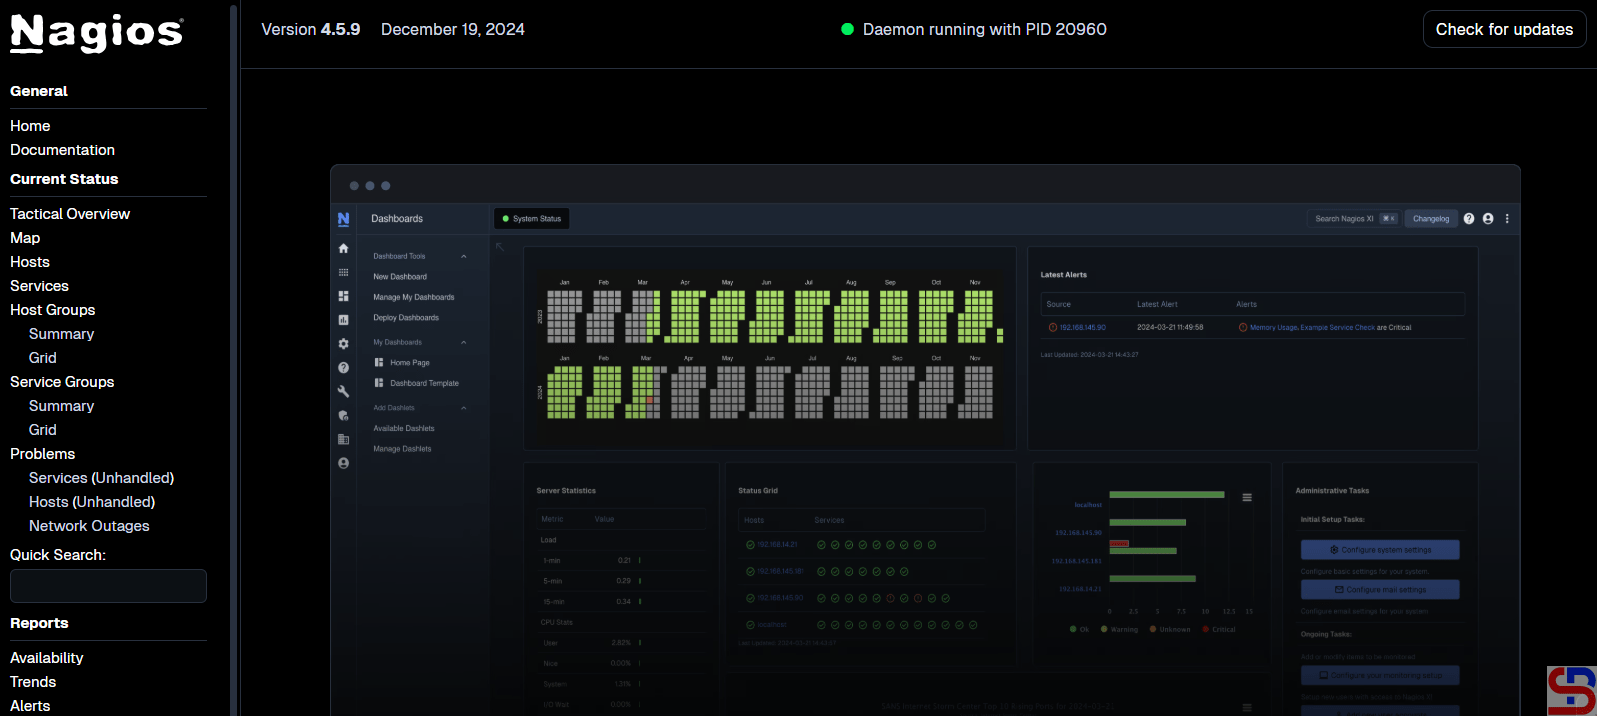
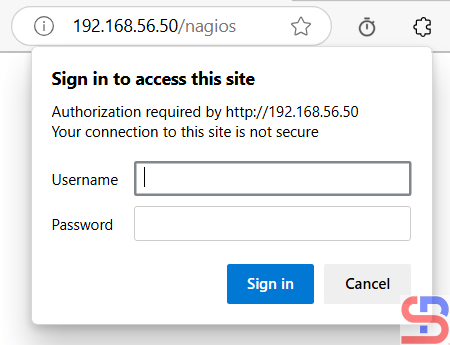
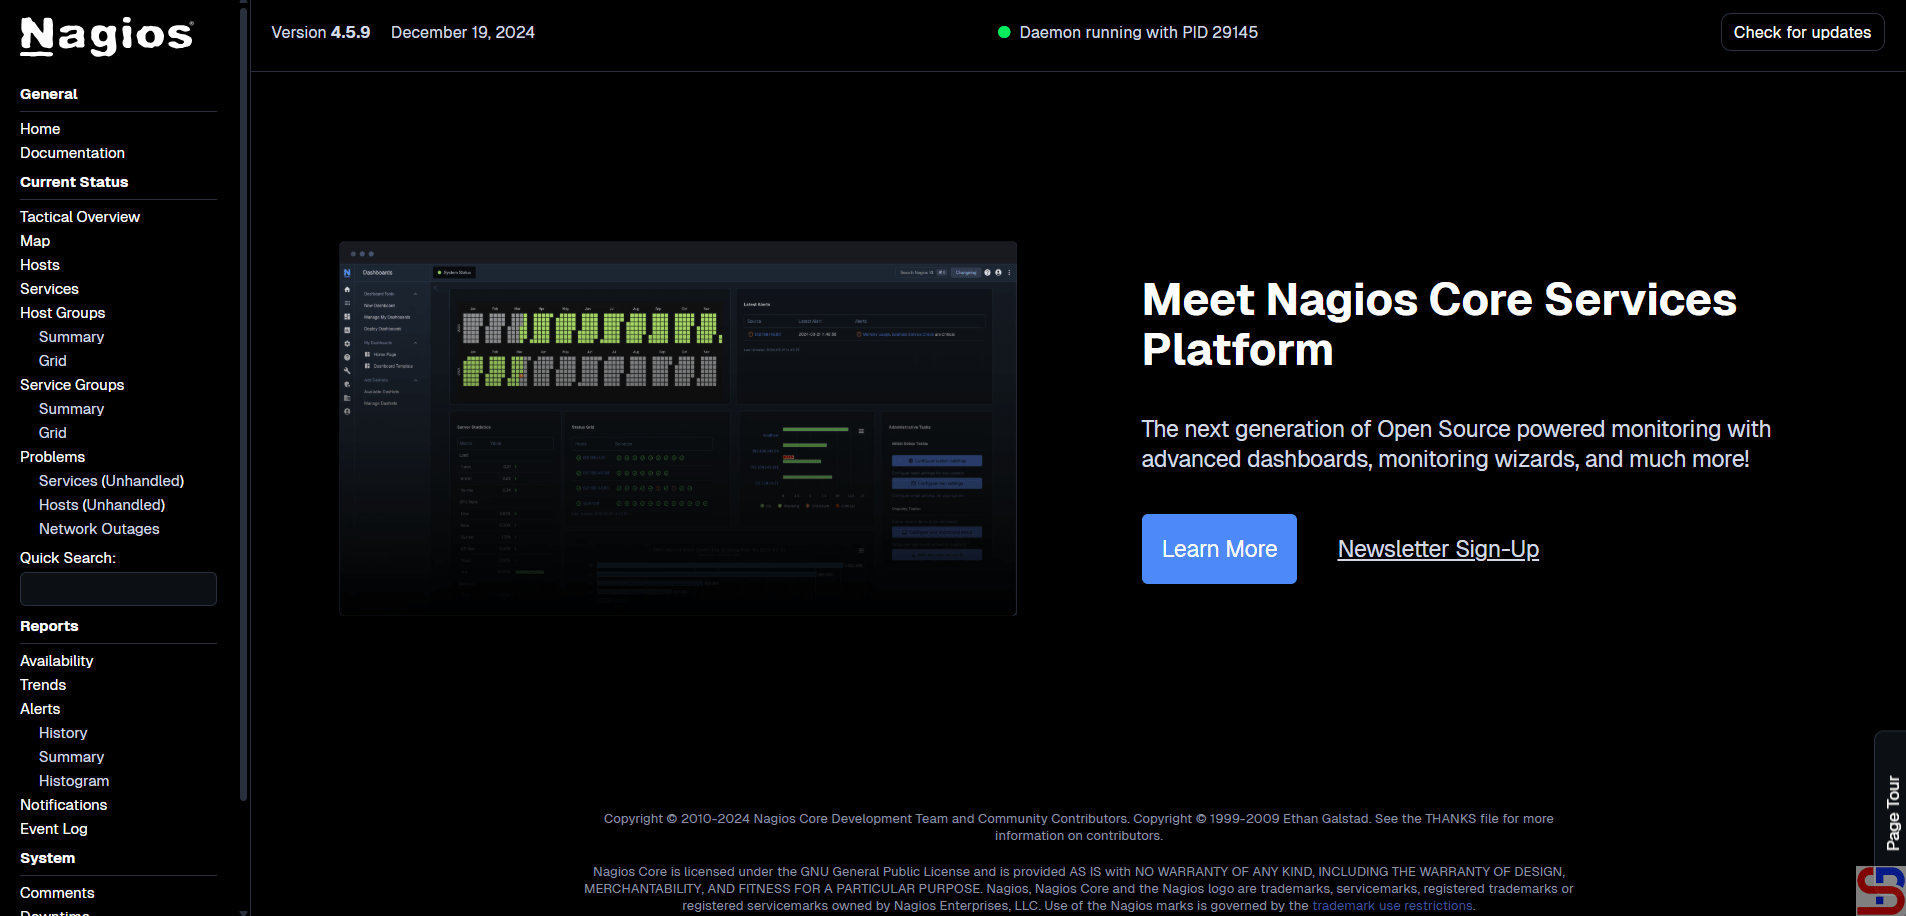
Back to your browser again, and it should work now. Insert the username (nagiosadmin) and the password for Nagios. If the username and the password are right, the Nagios application will appear like this:
Open the Nagios application
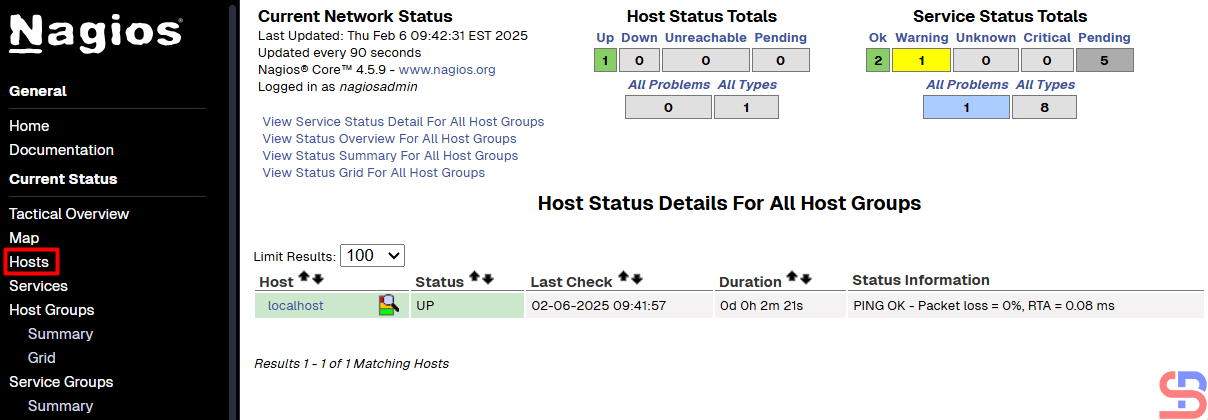
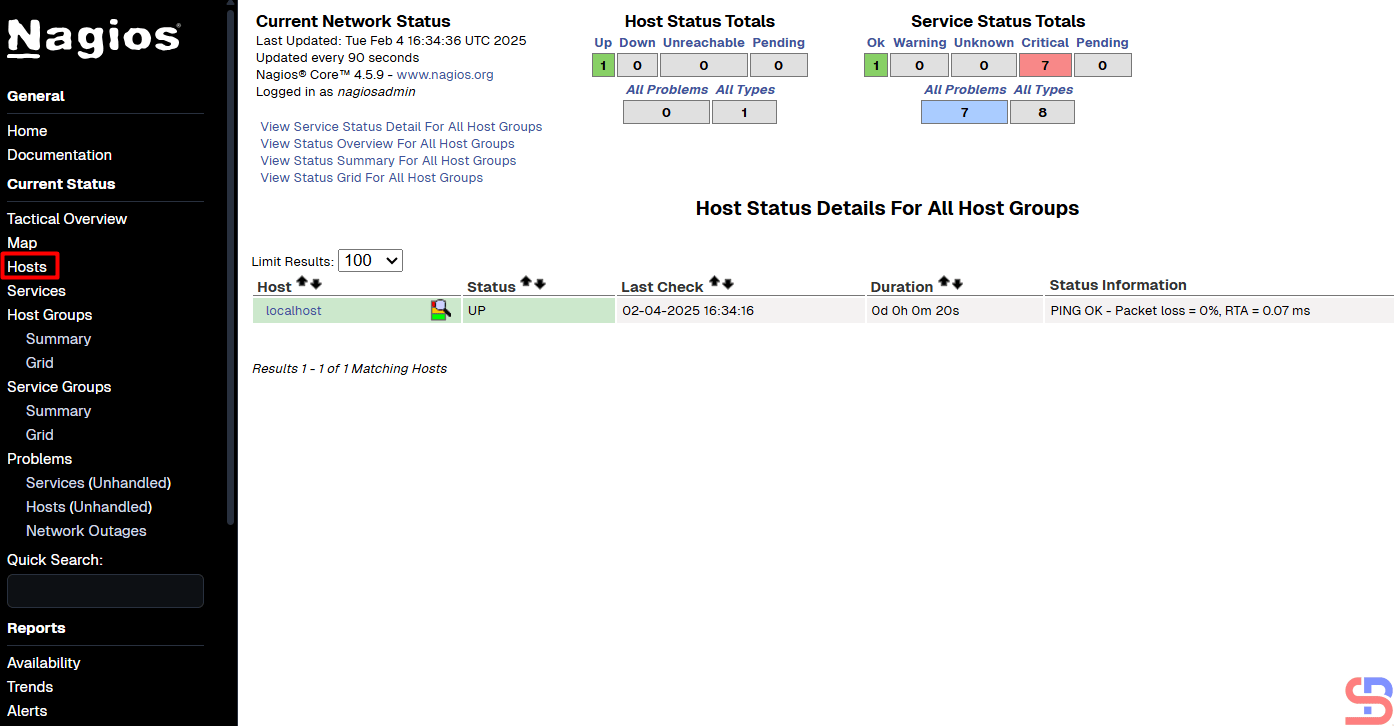
If you want to know which hosts are being monitored by Nagios, click Hosts. Nagios will display the hosts that are being monitored:
Hosts monitored by Nagios
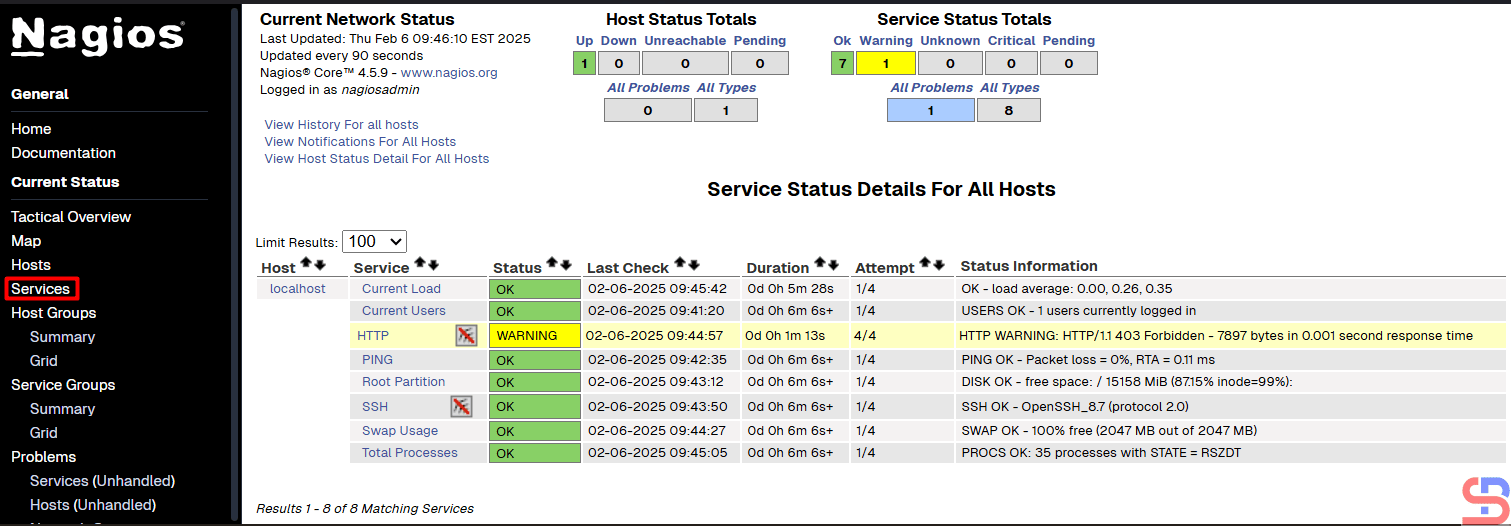
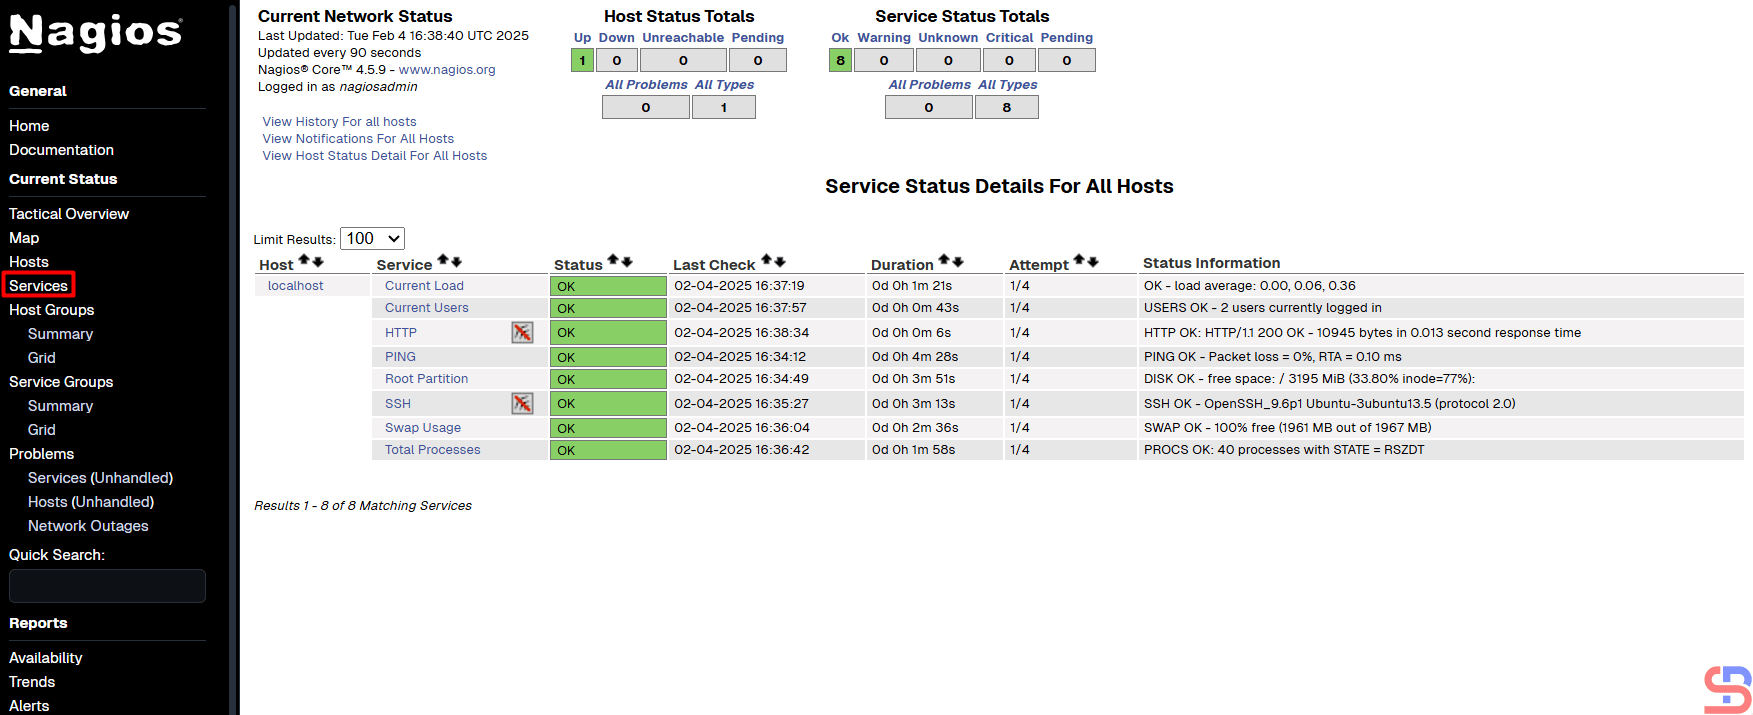
From the picture above, it can be seen that currently, Nagios is only monitoring the Nagios server or localhost. If you want to know which services are being monitored by Nagios, click Services. Nagios will display the services that are being monitored:
Services monitored by Nagios
From the picture above, you can see that Nagios monitored 8 services for the Nagios server or localhost.
Note
If you have a domain/subdomain and want to use that domain/subdomain for the Nagios application, create a virtual host on your web server. For example, I have the domain sysadminpedia.com and want to use the subdomain nagios.sysadminpedia.com for the Nagios application. So, I created the script below in the file /etc/httpd/conf.d/nagios.sysadminpedia.com.conf:
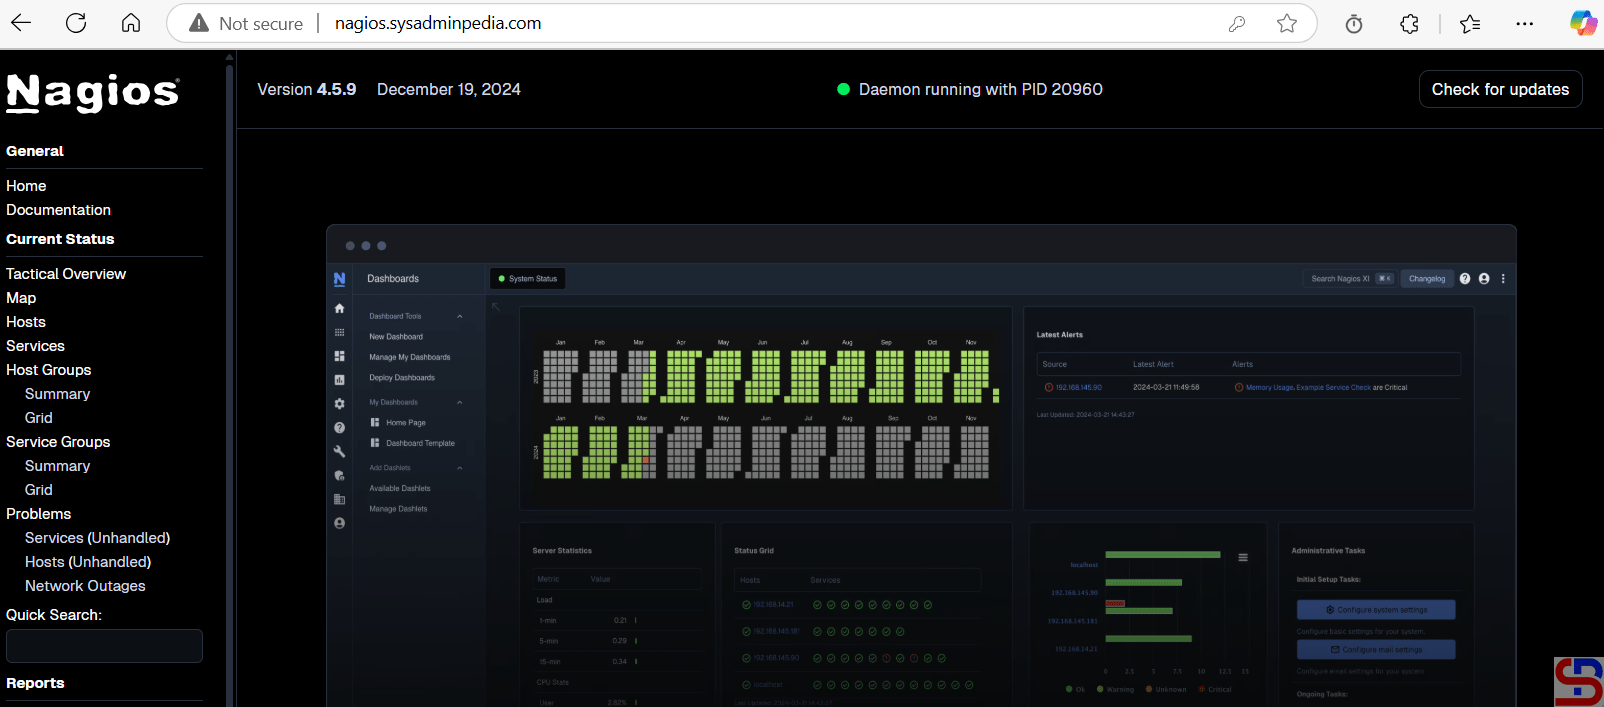
Restart the web server, open your browser, and type your domain/subdomain for Nagios, and it should be like the image below:
Using a domain or a subdomain for the Nagios application
Info
If you installed Nagios in a non-default folder, for example, in the /data folder, you can copy the script above, but you must change the word /usr/local to /data.
How to Display a File Without the Hashtag Sign on Linux?
written by sysadmin | 28 February 2025
If you open the configuration file on the Linux Server, you will usually find many comments used in the file, which are started by a hashtag sign (#). This aims to explain a configuration that is under comment. But sometimes you want to see the configuration without having to look at the explanation of the configuration.
Problem
How to display a file without the hashtag sign on Linux?
Solution
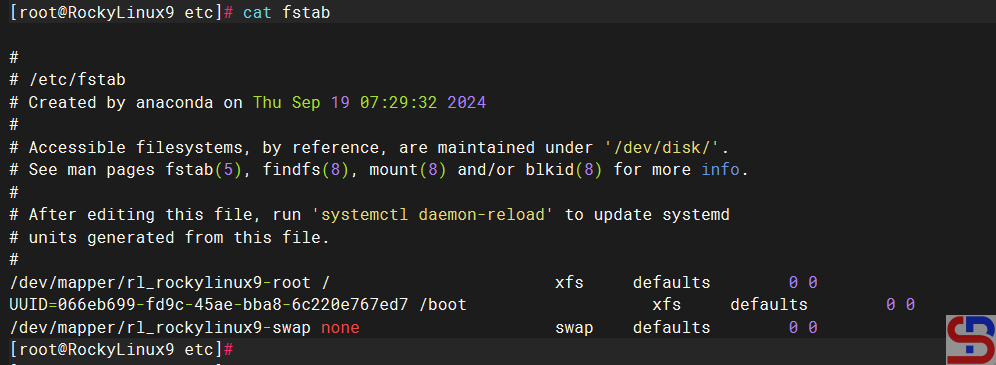
For example, I want to see the default configuration file for the fstab file, which is located at /etc/fstab, and by default, it will look like the image below:
The fstab file
As far as I know, there are 3 methods to display the file without the hash sign:
1. Using the grep command
To use the grep command, you can use the format below:
grep -v '#'filename
In this case, type the command below:
grep -v '#' /etc/fstab
And it will look like the image below:
Using the grep command
2. Using the sed command
To use the sed command, you can use the format below:
sed '/#/d'filename
In this case, type the command below:
sed '/#/d' /etc/fstab
And it will look like the image below:
Using the sed command
3. Using the awk command
To use the awk command, you can use the format below:
awk '! /#/'filename
In this case, type the command below:
awk '! /#/' /etc/fstab
And it will look like the image below:
Using the awk command
Note
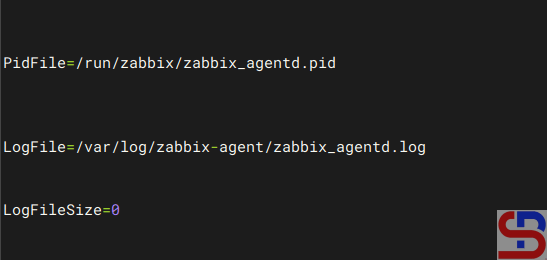
Usually, when you use either of the three commands above to display a sentence that does not start with a hash mark in a Linux file, the result may be a lot of empty spaces, for example, in the zabbix_agentd.conf file, as shown in the image below:
The initial output
So if you want to only display the results without any blank spaces, then use the command below:
and the result will be as shown in the image below:
The expected result
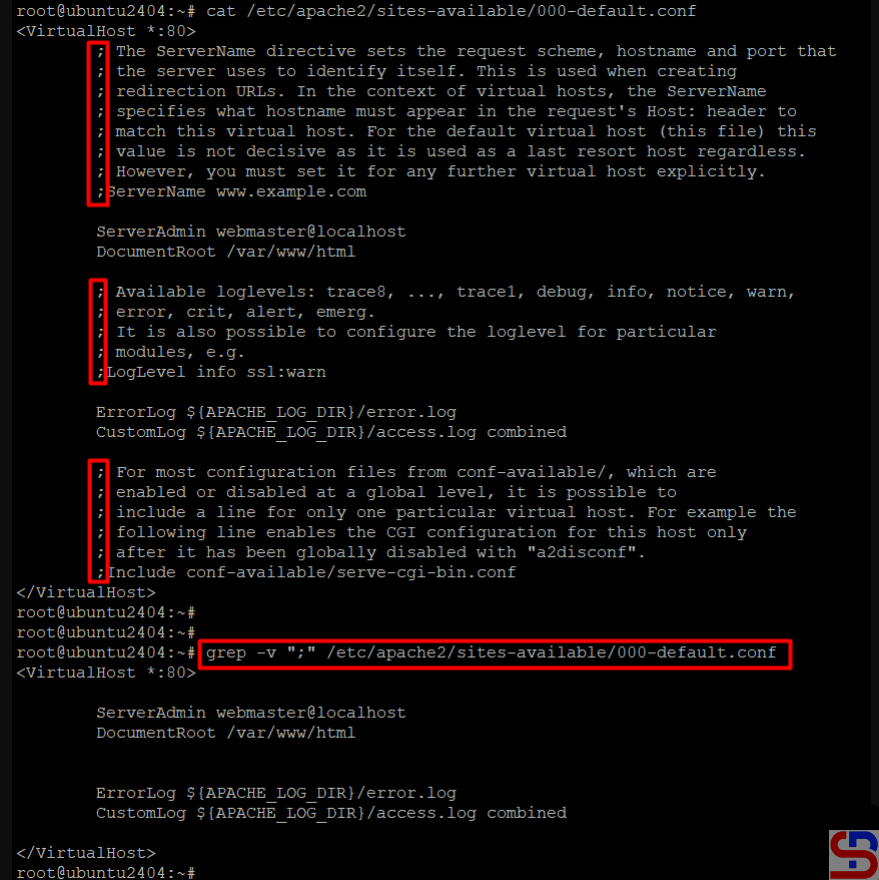
If the file comments do not use a hashtag sign, for example, use a semicolon (;), replace the hashtag sign with a semicolon sign in one of the commands above, and it should display a configuration that does not start with the semicolon sign:
Nagios is an event monitoring system created by Ethan Galstad and first released in 2002, which offers monitoring and alerting services for servers, switches, applications, and services. It alerts users when things go wrong and alerts them again when the problem has been resolved. There are 2 types of Nagios: Nagios XI for the enterprise version and Nagios Core for the free version. This article will explain how to install Nagios Core on Ubuntu.
Problem
How to install Nagios on Ubuntu?
Solution
Here are the steps to install Nagios on Ubuntu, and these steps work on Ubuntu 24.04 and below and I think it should also work on Debian.
1. Download the packages
Install the packages needed to install Nagios using the command below:
After that, create a user and group for Nagios using the commands:
sudo useradd nagios
sudo groupadd nagcmd
sudo usermod -a -G nagcmd nagios
sudo usermod -a -G nagcmd www-data
3. Download Nagios
Use the commands below to download Nagios, where at the time of this writing (February 2025), the latest version of Nagios is version 4.5.9:
cd /tmp
wget https://github.com/NagiosEnterprises/nagioscore/archive/refs/heads/master.zip -O nagios.zip
unzip nagios.zip
cd nagioscore-master/
4. Install Nagios
By default, Linux will create a Nagios folder in the /usr/local folder to save Nagios configuration files. So, use the following commands to install Nagios:
If you want to save all Nagios files in a non-default folder, for example, in the /data folder, then use the following command: sudo ./configure –prefix=/data/nagios –with-command-group=nagcmd –with-httpd-conf=/etc/apache2/sites-enabled
After that, run the following commands:
sudo make all
sudo make install
sudo make install-init
sudo make install-daemoninit
sudo make install-config
sudo make install-commandmode
sudo make install-webconf
sudo a2enmod rewrite
sudo a2enmod cgi
5. Create the password
Create a password for the user Nagios to access the Nagios application. Nagiosadmin is usually a popular username for Nagios, but you can create another.
If you installed Nagios in a non-default folder, for example, in the /data folder, execute the below command: sudo htpasswd -c /data/nagios/etc/htpasswd.users nagiosadmin
6. Download Nagios Plugins
Plugins are compiled executables or scripts (Perl, shell, Python, PHP, Ruby, etc.) that can be run from a command line to check the status of a host or service. Nagios Core uses the results from plugins to determine the current status of hosts and services on your network. As of this writing (February 2025), the latest version of Nagios plugins is version 2.4.12. You can check the latest version of Nagios plugins on this site. Run the following commands to download Nagios plugins:
cd /tmp
wget https://github.com/nagios-plugins/nagios-plugins/archive/refs/heads/master.zip -O nagios-plugins.zip
unzip nagios-plugins.zip
cd nagios-plugins-master/
7. Install Nagios Plugins
After that, install Nagios plugins using the following commands:
./tools/setup
sudo ./configure --with-nagios-user=nagios --with-nagios-group=nagios
sudo make
sudo make install
8. Check the configuration
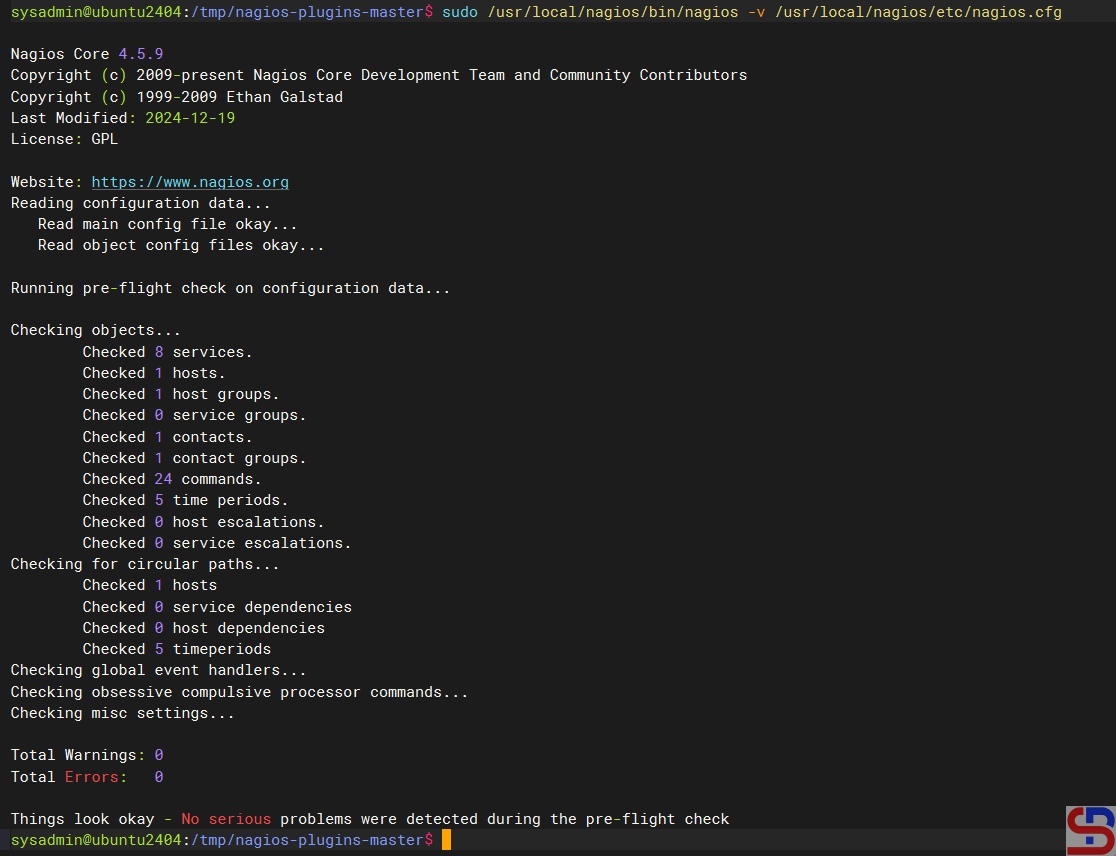
After installing Nagios and Nagios plugins, run the following command to check the configuration of Nagios:
If you installed Nagios in a non-default folder, for example, in the /data folder, execute the below command: sudo /data/nagios/bin/nagios -v /data/nagios/etc/nagios.cfg
and make sure there is no error like in the image below:
And there should be a display like the image below:
Open Nagios in the browser
If you don’t see the image like the above image in your browser, maybe the Firewall/IPTables is still on your server. Run the following commands:
sudo ufw allow Apache
sudo ufw reload
Back to your browser again, and it should work now. Insert the username (nagiosadmin) and the password for Nagios. If the username and the password are right, the Nagios application will appear like this:
Nagios application
If you want to know which hosts are being monitored by Nagios, click Hosts, and Nagios will display the hosts that are being monitored:
Hosts monitored by Nagios
You can see from the picture above, Nagios only monitors the Nagios server or localhost. If you want to know which services are being monitored by Nagios, click Services then Nagios will display the services that are being monitored:
Services monitored by Nagios
From the picture above, Nagios monitors 8 services for the Nagios server or localhost.
Note
If you have a domain/subdomain and want to use that domain/subdomain for the Nagios application, create a virtual host on your web server. For example, I have the domain sysadminpedia.com and want to use the subdomain nagios.sysadminpedia.com for the Nagios application. So, I created the script below in the file /etc/apache2/sites-enabled/nagios.sysadminpedia.com.conf:
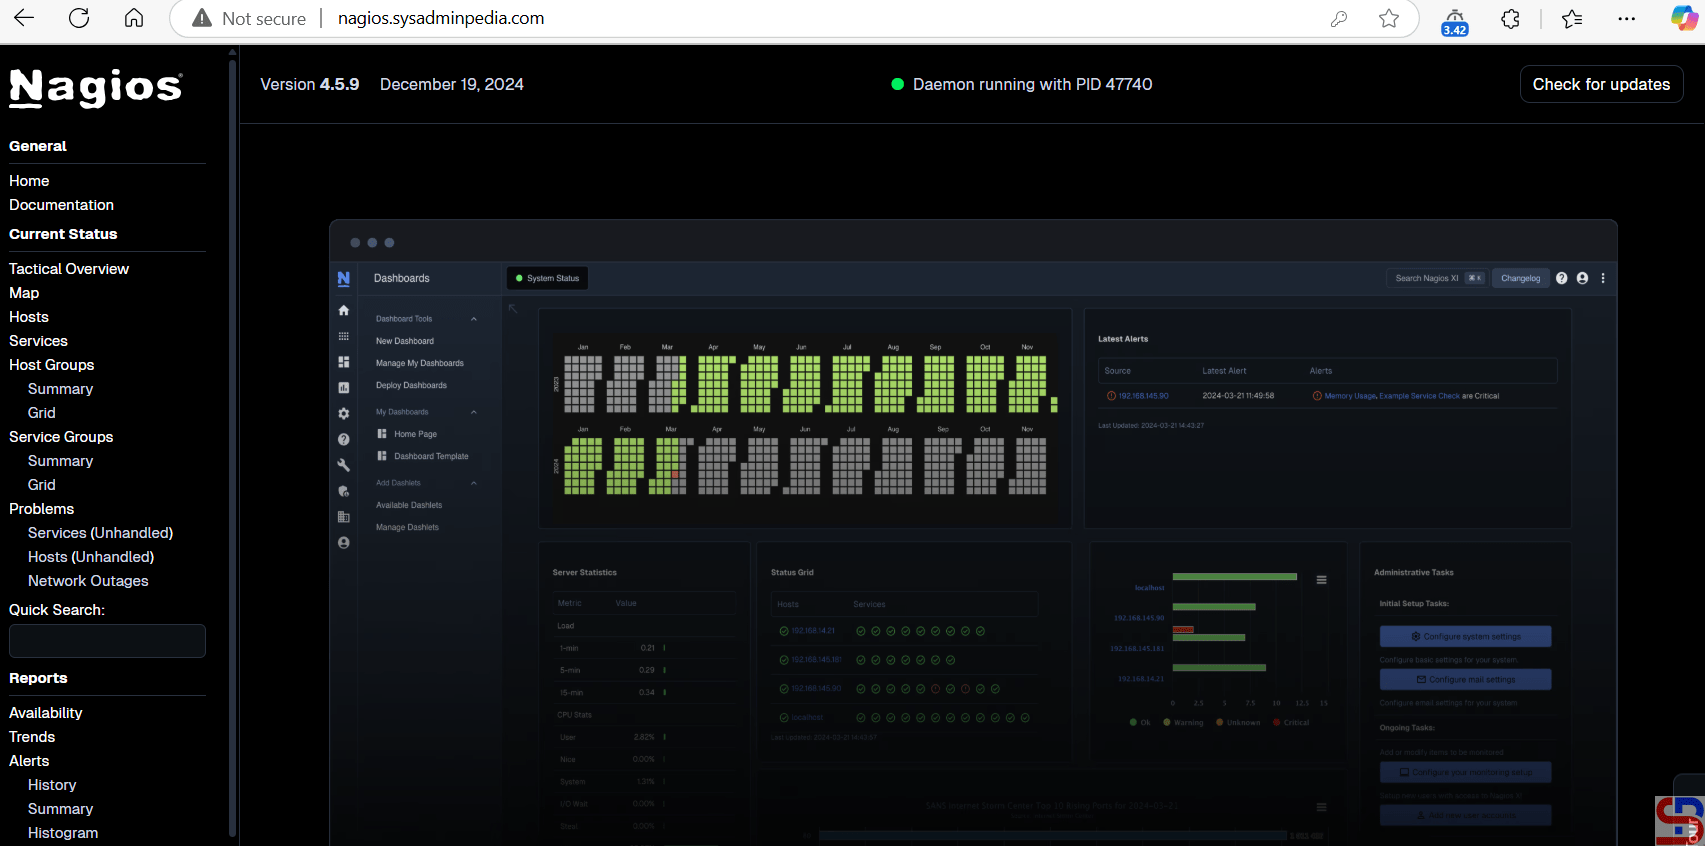
Restart the webserver, open your browser, and type your domain/subdomain for Nagios, and it should be like the image below:
Using a domain/subdomain for the Nagios application
Info
If you installed Nagios in a non-default folder, for example, in the /data folder, you can copy the script above, but you must change the word /usr/local to /data