How to Display MariaDB Database Metric Values?
I want to see the metric values of my MariaDB database.
Problem
How to display MariaDB database metric values?
Solution
As far as I know, there are 2 tools that you can use to display the values of metrics on your MariaDB database.
1. mariadb-report
This tool is built into MariaDB, so when you install the MariaDB database or mariadb-client on your server, this tool will automatically be installed on your server. In general, use the format below to run this command:
mariadb-report --user=username --password your_password
If you want to display MariaDB database metrics using the root user, then use the command below:
mariadb-report --user=root --password
Enter the password for the root user, and a display will appear as below:

If you want to put the results into a file, you can use the command below:
mariadb-report --user=root --password --outfile /tmp/metric.txt
Enter the password, and the results will be entered into the /tmp/metric.txt file.
2. mysqlmonitor
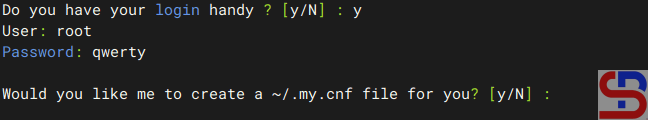
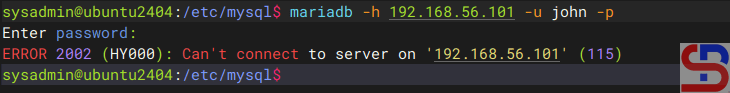
This is a simple bash script created to give system administrators and database administrators a fast summary of MySQL metrics. It presents essential metrics such as InnoDB buffer utilization, query efficiency, and system memory, accompanied by concise descriptions of each parameter. To run this script, you must create MariaDB credentials in the my.cnf file, because if not, there will be an error like the one below:

Copy the script below and insert it into the my.cnf file:
[client]
user=username
password=your_password
To download and run the script, run the commands below:
curl -O https://raw.githubusercontent.com/haydenjames/mysqlmonitor-script/main/mysqlmonitor.sh &&
chmod +x mysqlmonitor.sh &&
./mysqlmonitor.sh
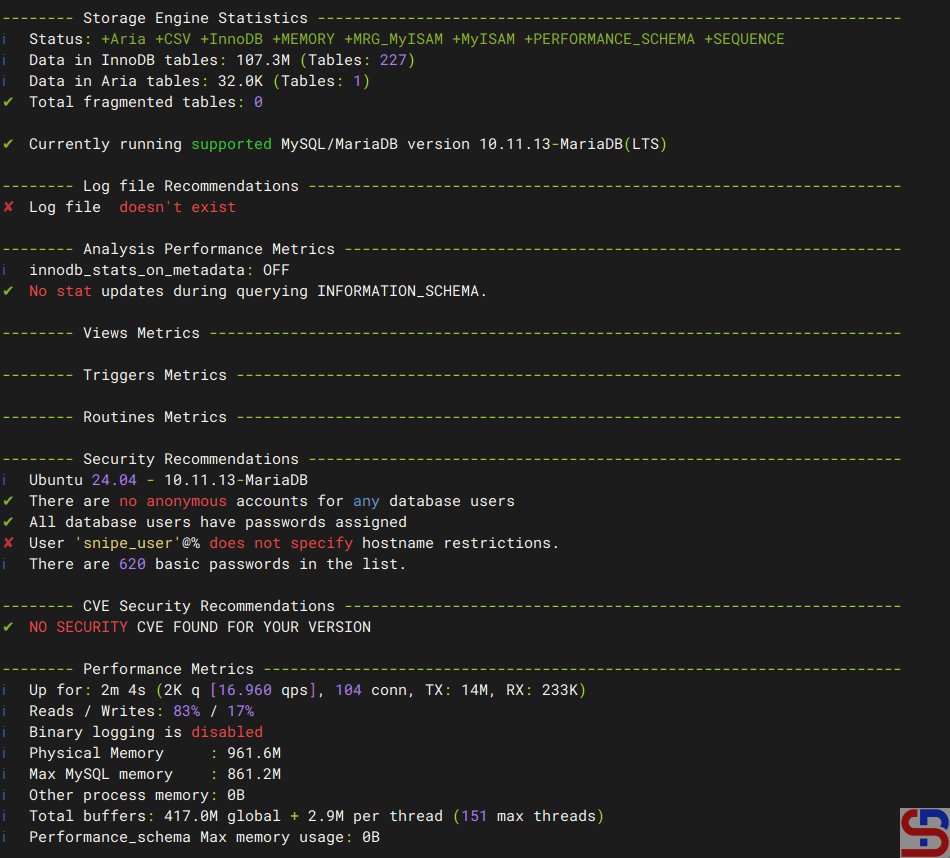
There will be a display like the image below:

From the image above, you can see that the results from the mysqlmonitor tool are more concise than the mariadb-report tool. To exit this tool, press the q key.
Note
If you want detailed metric results, then you can use the mariadb-report tool. However, if you want more concise metrics, you can use the mysqlmonitor tool.